Chisel D.2019.4.2.2
Christian. Degrigny (HE-Arc CR, Neuchâtel, Neuchâtel, Switzerland) & Naima. Gutknecht (HE-Arc CR, Neuchâtel, Neuchâtel, Switzerland) & Valentina. Valbi (Laboratoire Métallurgie et Culture LMC-IRAMAT-CNRS-UTBM, Belfort, Franche-Comté, France)
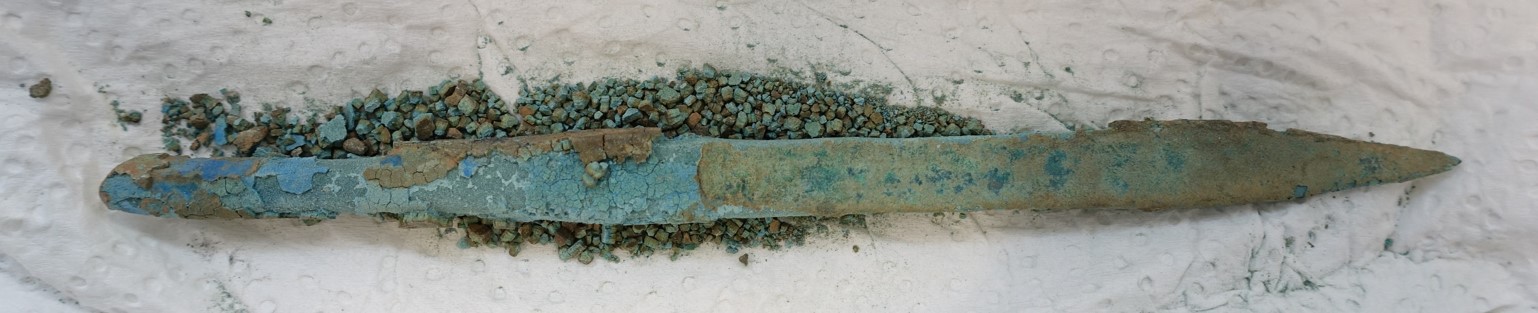
Pointed elongated tool used for piercing holes. It is covered with brown crust and blue-green corrosion products that show areas of flaking. Dimensions: L = ca. 13cm. W = ca. 3cm.
Tool
Granges Feuillet, dépôt n°2, Salins-les-Bains, Franche-Comté, France
2012
Late Bronze Age
Soil
Musée de Lons-le-Saunier, Lons-le-Saunier, Franche-Comté
Musée de Lons-le-Saunier (dépôt de Salins-les-Bains)
D.2019.4.2.2
N/a
From the time of excavation in 2012 until its entry into the museum in 2015, the object was kept in a food storage box in an uncontrolled environment. Flaking corrosion was documented when the object was collected and stored by the museum in 2015.
 Credit HE-Arc CR, N.Gutknecht.
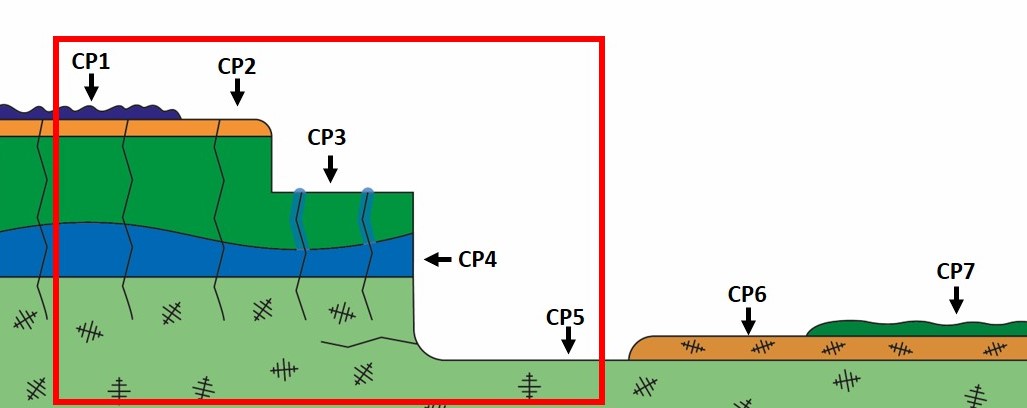
The schematic representation below gives an overview of the corrosion structure encountered on the chisel from a first visual macroscopic observation.
| Strata | Type of stratum | Principal characteristics |
| CP1 | Corrosion product | dark blue, thin, scattered, compact, brittle, soft |
| CP2 | Corrosion product | light brown, medium, discontinuous, compact, very hard |
| CP3 | Corrosion product | green, thick, discontinous, non-compact, very soft |
| CP4 | Corrosion product | blue, thin, discontinuous, non-compact, soft |
| CP5 | Corrosion product | dark green, medium, continuous, non-compact, very soft |
| CP6 | Corrosion product | light orange, thin, isolated, non-compact, very soft |
| CP7 | Corrosion product | dark green, thin, isolated, compact, soft |
Table 1: Description of the principal characteristics of the strata as observed under binocular and described according to Bertholon's method.
A fragment was selected from those corrosion products that spontaneously detached from the object.
Cu Alloy
Cast
Centre de Conservation et d’Etude René-Rémond, Lons-le-Saunier
Centre de Conservation et d’Etude René-Rémond, Lons-le-Saunier
April 2021
None.
Invasive approach (on the sample)
- Optical microscopy: the sample is polished, then it is observed with a numerical microscope KEYENCE VHX-7000 in bright and dark field.
- SEM-EDX: the sample is coated with a carbon layer, then analyses are performed on a SEM-FEG JEOL 7001-F equipped with a silicon-drift EDX Oxford detector (Aztec analysis software) with an accelerating voltage of 20 kV and probe current at about 9 nA. The relative error is considered of about 10% for content range <1mass%, and of 2% for content range of >1mass%.
- µ-Raman spectroscopy: it is performed on a HORIBA Labram Xplora spectrometer equipped of a 532 nm laser with 1800 grating, the laser power employed is between 0.04 and 0.55 mW with acquisition time varying between 1 and 5 minutes.
None.
As it was not possible to cut the object to collect samples, the metal could not be documented. Only external corrosion layers were analyzed.
None
Cu
Sn
None.
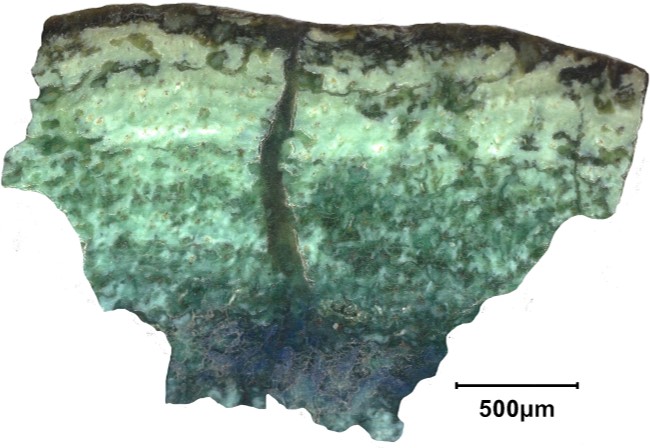
The observation of the sample in cross-section in dark field allowed to identify an external brown 200 µm thick stratum (CP1), a green 1000 µm thick stratum (CP2), a turquoise 400 µm thick stratum (CP3) with blue aggregates.
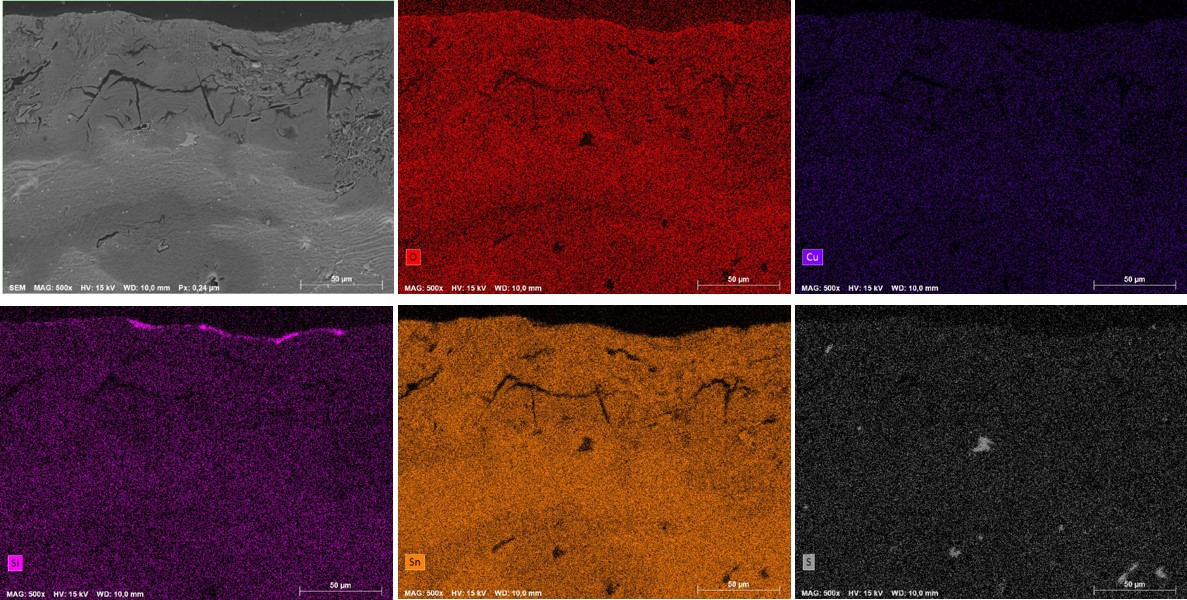
The EDX analysis of the identified strata shows that the whole corrosion structure is Cu depleted and Sn enriched and polluted with external elements such as Fe, Al, Si and P. This Sn-rich phase was analysed by Raman spectroscopy (R01) and shows a broad band at 560 cm-1 that can be attributed to nanocassiterite (SnO2) by comparison to the work of Ospitali et al. 2012. A sharp peak at 999 cm-1 is also observed and could be attributed to the presence of phosphates.
S-rich dark inclusions (Figs. 8-9) were observed in the whole corrosion structure and were identified as covellite (CuS) by Raman spectroscopy (R04).
The blue aggregates in the CP3 are Cu enriched and were identified as azurite (Cu3(CO3)2(OH)2) by Raman spectropscopy (R10).
| CP1 | CP2 | CP3 | CP3 aggregates | |
| O | 35 | 28 | 30 | 37 |
| Sn | 47 | 55 | 50 | 17 |
| Cu | 11 | 11 | 15 | 42 |
| Si | 1 | 1 | 1 | <0.5 |
| Al | 2 | 1 | <0.5 | 1 |
| Fe | 2 | 1 | 2 | <0.5 |
| P | <0.5 | <0.5 | 1 | <0.5 |
Table 2: Chemical composition (mass%) of the corrosion layers over a general area of analysis in cross-section obtained by SEM-EDX, LMC-IRAMAT-CNRS-UTBM.
 Credit LMC-CNRS, V.Valbi.
 Credit LMC-CNRS, V.Valbi.
Uniform
Unknown
None.
The stratigraphies obtained by binocular and cross-section observation show several differences. The sample observed in cross-section is collected from the flaked material and is thus representing a different location than the binocular observation performed on the whole object (Fig. 2).
The flaked sample used for the cross-section observation includes the corrosion layers above the "flaking interface" located between CP4 and CP5 in binocular view. Thus the strata under the flaking interface did not get sampled. CP1 from the binocular view was not observed in the selected sample either.
The corrosion structure has a homogeneous composition despite the colour differences observed. The fragment of the chisel from Salins-les-Bains shows an Sn enrichment typical of the decuprification phenomenon of bronze alloys. A local enrichment in copper is observed due to the formation of the hydroxycarbonate azurite in the most internal stratum. The dark covellite inclusions are most likely residuals of copper sulfide inclusions from the metal microstructure resulting from the smelting of S-containing ores.
References on analytical methods and interpretation
1. Lafuente, B., Downs, R. T., Yang, H., Stone, N. (2015) The power of databases: the RRUFF project. In: Highlights in Mineralogical Crystallography, T. Armbruster and R. M. Danisi, eds. Berlin, Germany, W. De Gruyter, 1-30.
2. Ospitali, F., Chiavari, C., Martini, C., Bernardi, E., Passarini, F., Robbiola, L. (2012) The characterization of Sn-based corrosion products in ancient bronzes: a Raman approach. Journal of Raman Spectrpscopy, 43 (11), 1596-1603.
3. Robbiola L., Blengino M., Fiaud C., (1998) Morphology and mechanisms of formation of natural patinas on archaeological Cu–Sn alloys. Corrosion Science, 40 (12), 2083-2111.