Earstick SMRA 20-19047-03
Christian. Degrigny (HE-Arc CR, Neuchâtel, Neuchâtel, Switzerland) & Naima. Gutknecht (HE-Arc CR, Neuchâtel, Neuchâtel, Switzerland) & Valentina. Valbi (Laboratoire Métallurgie et Culture (LMC), Belfort, Franche-Comté, France)
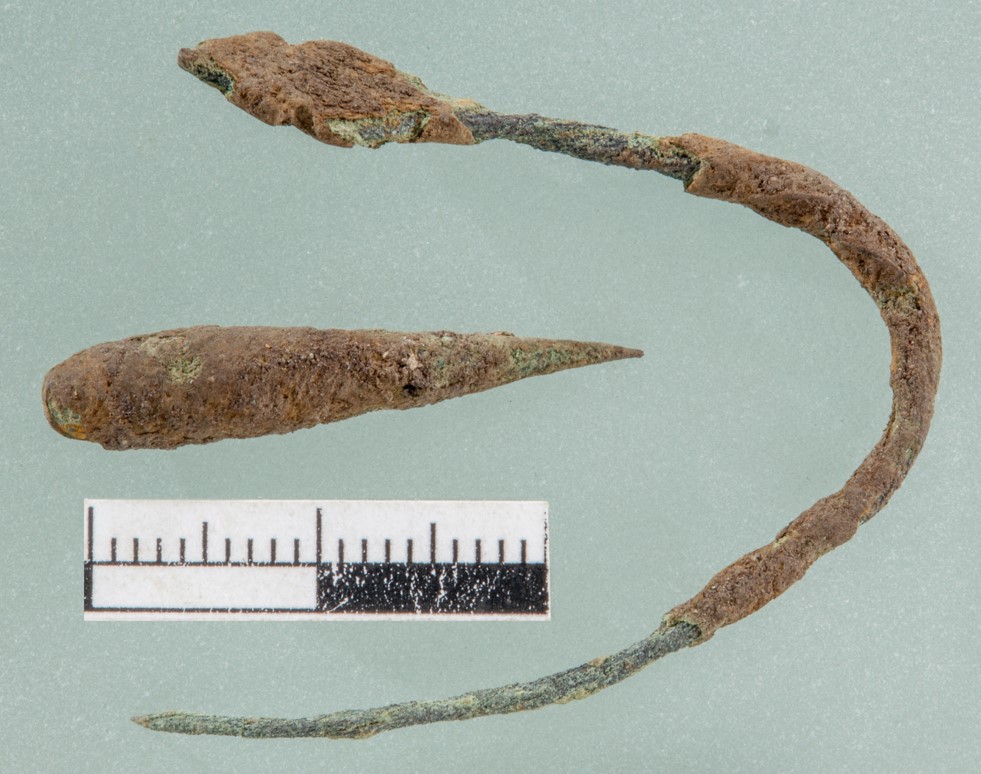
Curved and twisted earstick with a leaf-shaped head. The drop-shaped metal part is probably connected to the object. Typology Riha 1986: B variation. L = 4cm (curved part) and 2.6cm (drop-shaped part). W = 3.2g.
Toilet instrument
Avenches, Switzerland, Avenches, Vaud, Switzerland
2020
Roman Times
Soil
Site et musée romains Avenches, Avenches, Vaud
Site et musée romains Avenches, Avenches, Vaud
SMRA 20/19047-03
N/a
The earstick was found at village Derrière les murs, near Avenches.
 Credit SMRA/HE-Arc CR, N.Gutknecht.
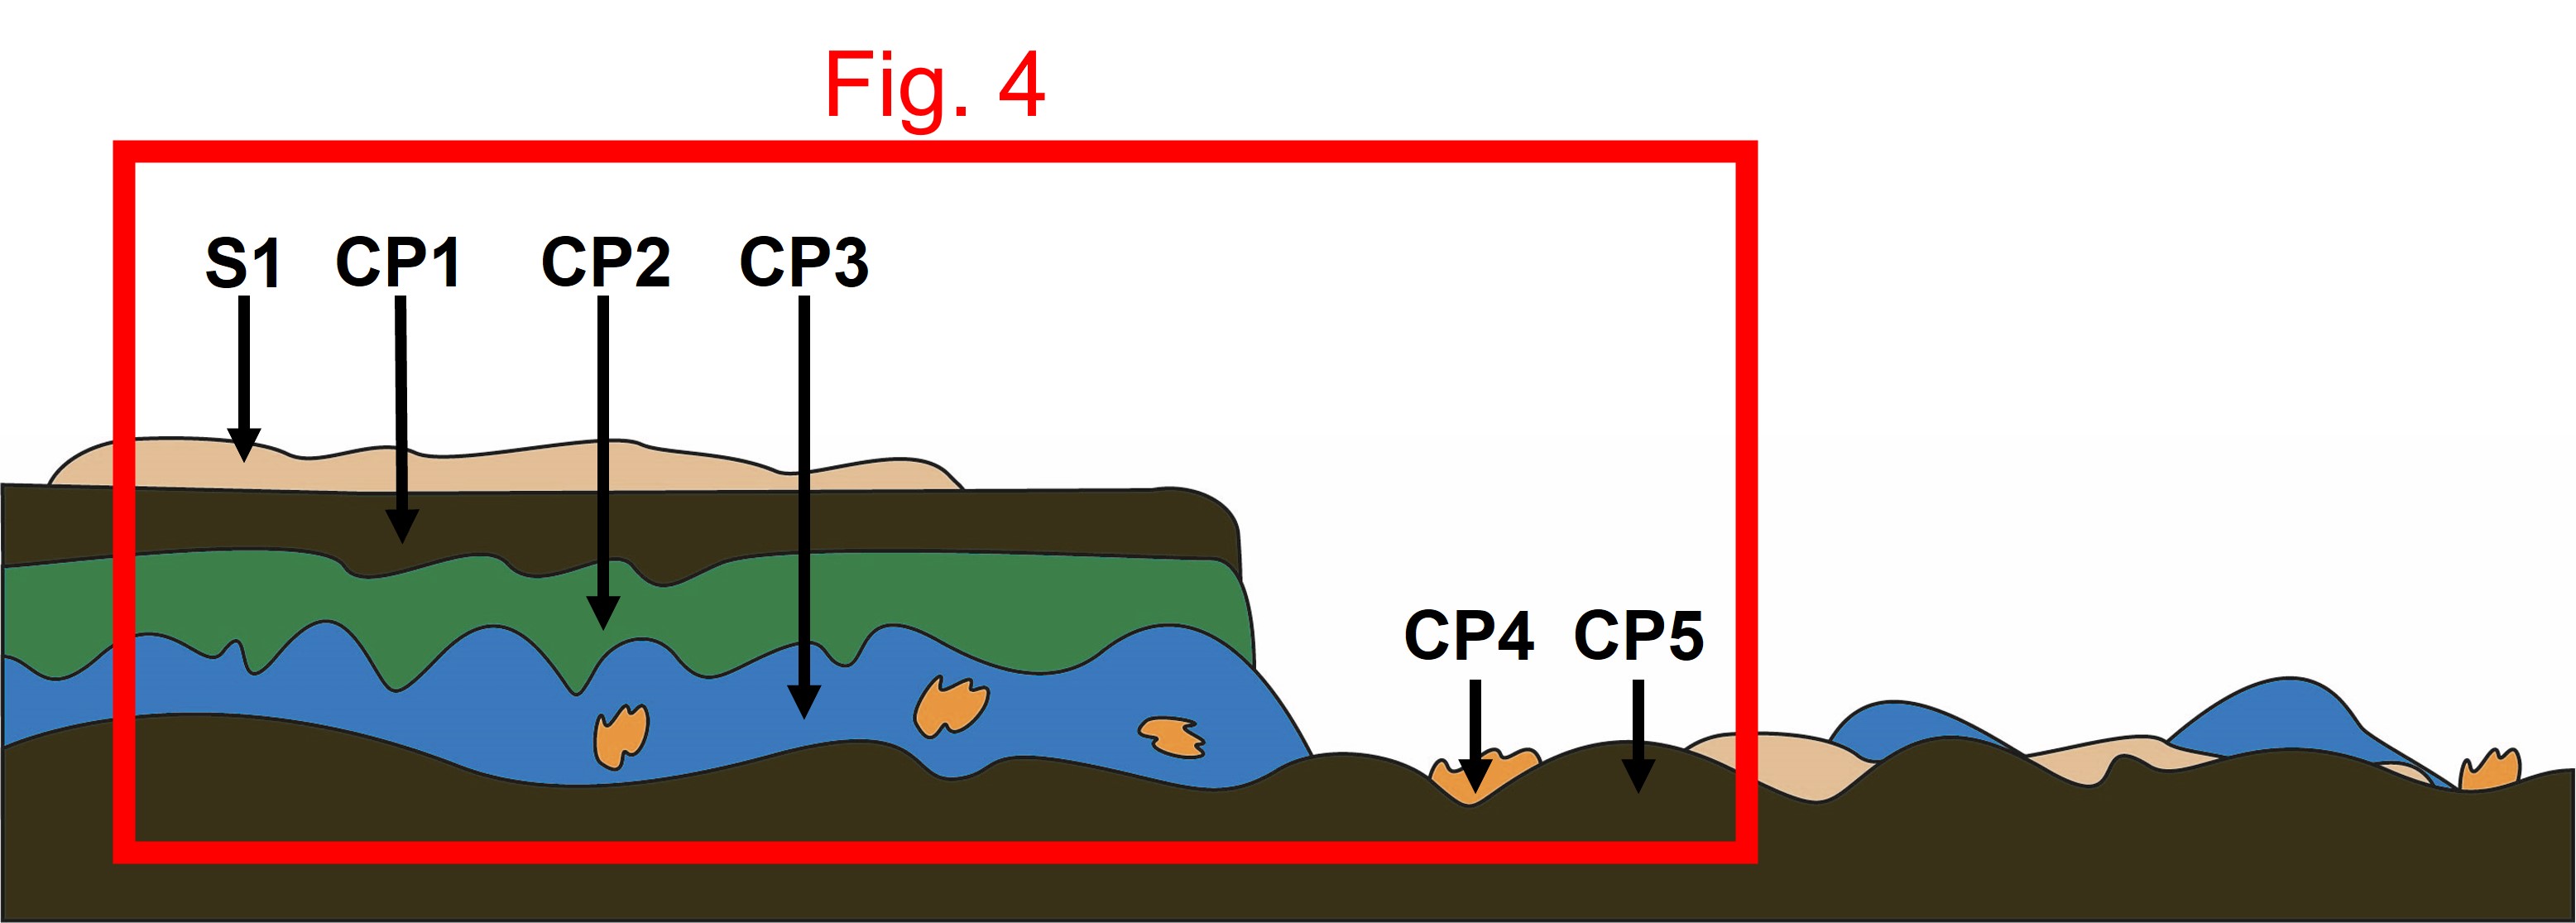
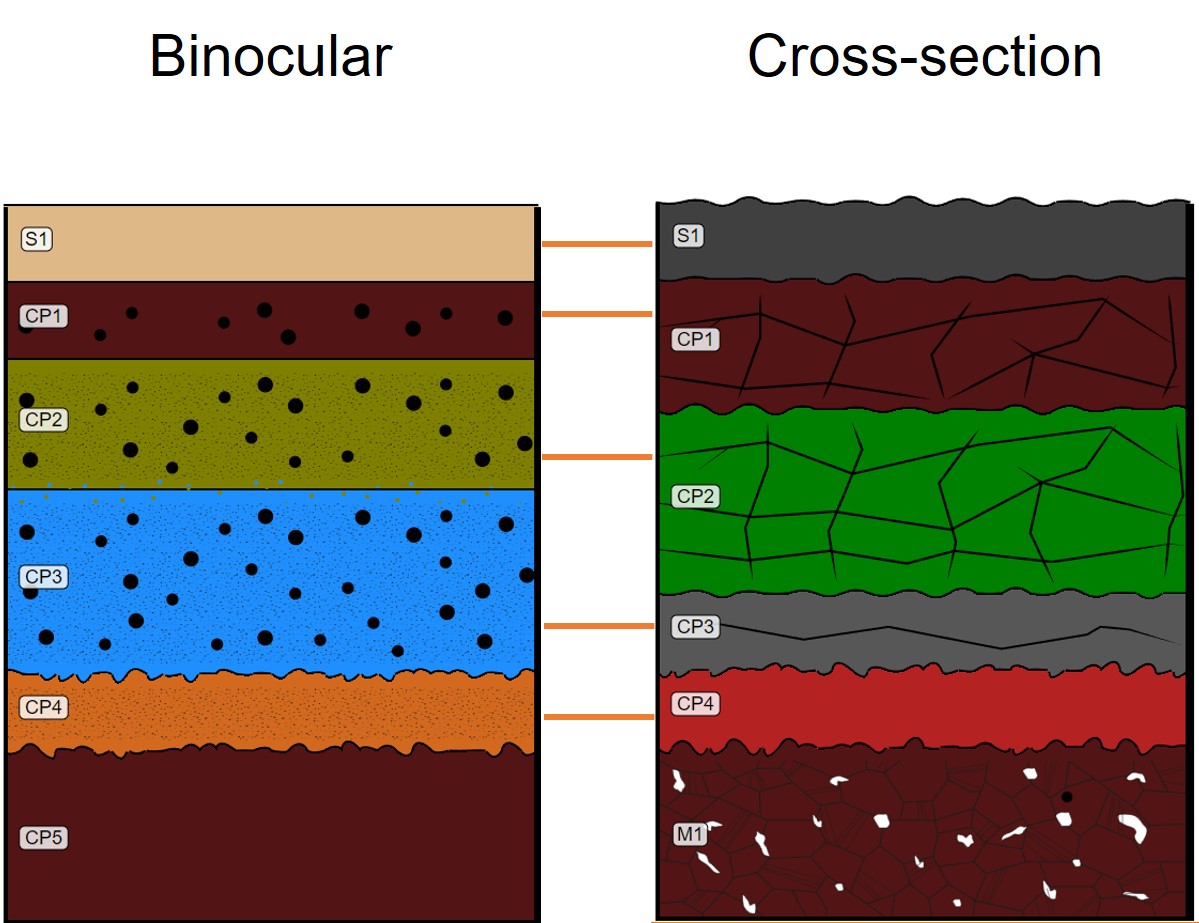
The schematic representation below gives an overview of the corrosion structure encountered on the earstick from a first visual macroscopic observation.
| Strata | Type of strata | Principal characteristics |
| S1 | Soil | layer, light brown, thin, discontinuous, matte, compact, friable, very soft |
| CP1 | Corrosion product | layer, dark brown, thin, discontinuous, matte, non compact, friable, very soft |
| CP2 | Corrosion product | layer, dark green, medium, discontinuous, non compact, powdery, very soft |
| CP3 | Corrosion product | layer, blue, thick, discontinuous, non compact, powdery, very soft |
| CP4 | Corrosion product | nodule, dark orange, thin, scattered, matte, compact, powdery, soft |
| CP5 | Corrosion product | layer, dark brown, thick, continuous, matte, compact, tough, hard |
Table 1: Description of the principal characteristics of the strata as observed under binocular and described according to Bertholon's method.
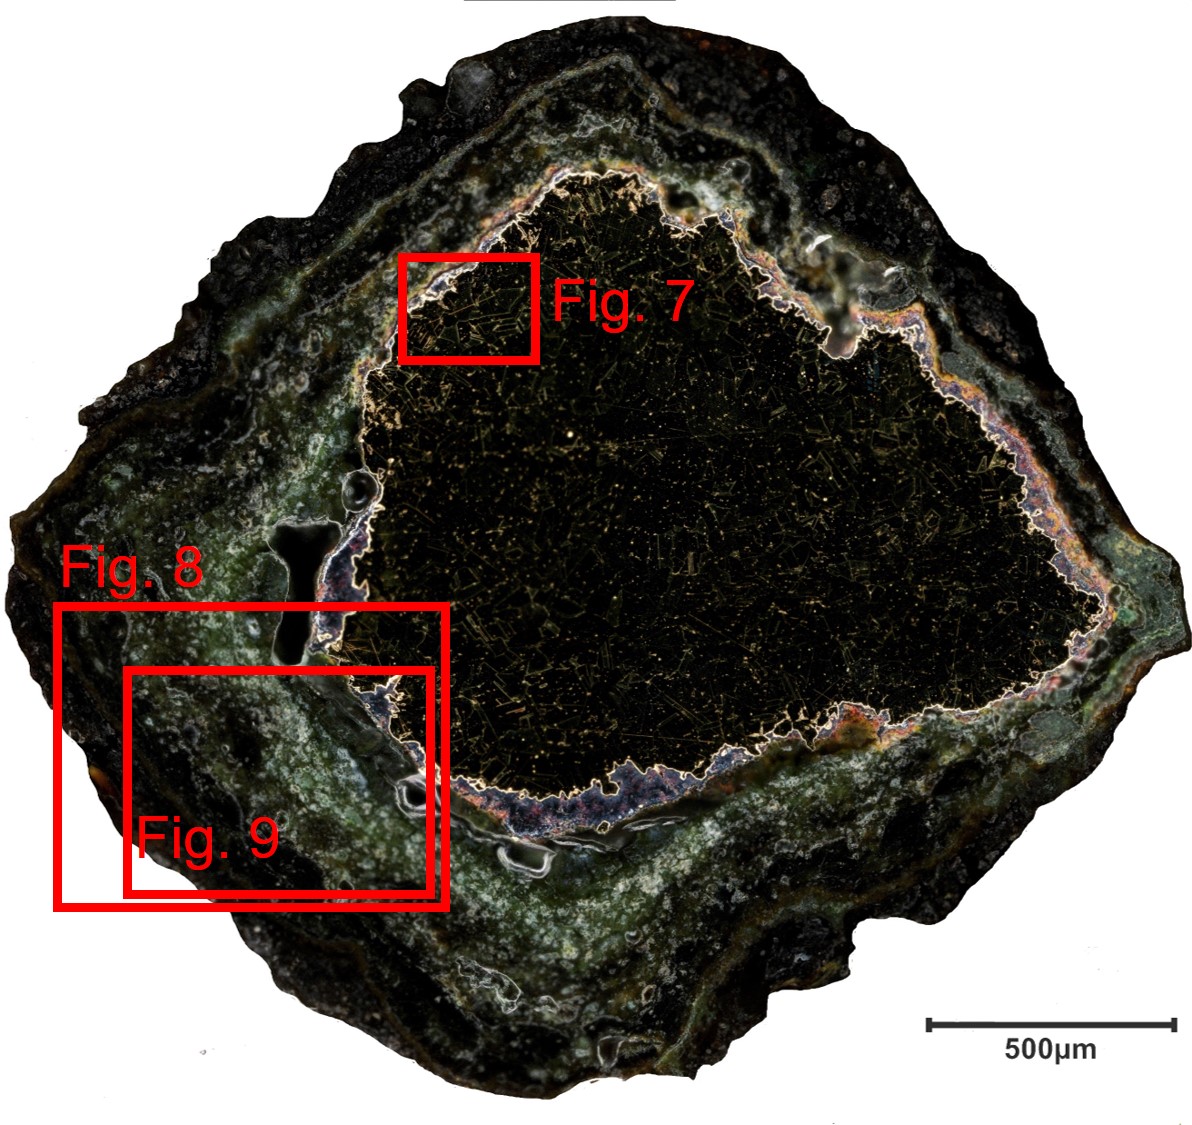
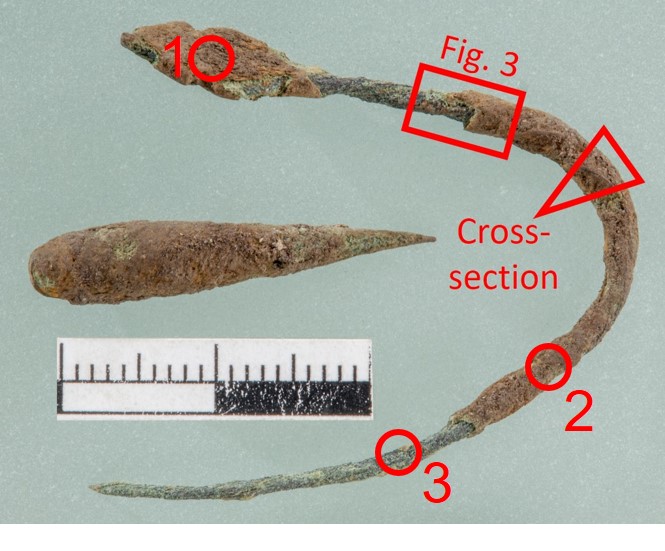
The cross-section corresponds to a lateral cut (Fig. 2). The sample was cut from the central body of the object after embedding one part of the object in the resin. The cross-section is representative of the entire thickness of the object body. A metal core is still present under the corrosion layers (Fig. 5).
Brass
Annealed after cold working
Avenches_cureoreille
Site et musée romains Avenches, Avenches, Vaud
Site et musée romains Avenches, Avenches, Vaud
January 2021
Sample taken from the object is embedded in resin and kept by the institution with the object if further analysis is needed.
Analyses performed:
Non-invasive approach
- XRF with handheld portable X-ray fluorescence spectrometer (NITON XL3t 950 Air GOLDD+, Thermo Fischer®). General Metal mode, acquisition time 60s (filters: Li20/Lo20/M20).
Invasive approach (on the sample)
- Optical microscopy: the sample is polished, then it is observed using a digitial microscope KEYENCE VHX-7000 in bright and dark field.
- Metallography: the polished sample is etched with alcoholic ferric chloride and observed by optical microscopy in bright field.
- SEM-EDS: the sample is coated with a carbon layer and analyses are performed on a SEM-FEG JEOL 7001-F equipped with a silicon-drift EDS Oxford detector (Aztec analysis software) with an accelerating voltage of 20 kV and probe current at about 9 nA. The relative error is considered of about 10% for content range <1wt%, and of 2% for content range of >1wt%.
- µ-Raman spectroscopy: it is performed on a HORIBA Labram Xplora spectrometer equipped with a 532 nm laser with 1800 grating, the laser power employed is between 0.04 and 0.55 mW with acquisition time varying between 1 and 5 minutes.
XRF analyses were carried out on the surface of the object (Fig. 2). All strata (soil, corrosion products, and metal) are analyzed at the same time. The metal is presumably a brass alloy or a ternary bronze alloy with some lead, while Si, Fe, Al, and P are probably coming from the burial environment.
Analyses 1 and 2 were carried out where corrosion and soil layers were present and 3 where the corrosion layers flaked. Point 3 is therefore the closest to the composition of the core metal.
| Elements (wt%) | 1 | σ |
2 | σ |
3 | σ |
| Cu | 44.6 | 0.13 | 49.2 | 0.21 | 83.7 | 0.31 |
| Si | 20.2 | 0.13 | 24.5 | 0.18 | 0.5 | 0.09 |
| Sn | 4.9 | 0.02 | 1.8 | 0.02 | 1.1 | 0.03 |
| Zn | 3.7 | 0.02 | 3.1 | 0.03 | 12.5 | 0.09 |
| Pb | 3.5 | 0.02 | 1.2 | 0.02 | 0.3 | 0.02 |
| Si | 20.2 | 0.13 | 24.5 | 0.18 | 0.5 | 0.09 |
| Fe | 13.2 | 0.05 | 8.3 | 0.05 | 0.2 | 0.02 |
| Al | 5.9 | 0.17 | 7.1 | 0.26 | n.d. | n.d. |
| P | 2.8 | 0.04 | 4.1 | 0.07 | 0.3 | 0.04 |
Table 2: Chemical composition of the surface of the earstick at three representative points shown in Fig. 2 (n.d.: below the detection limit), UR-Arc CR.
EDX analysis (Table 3) of the residual metal on cross-section indicates that it is a Cu-Zn brass alloy with a medium-high amount of Zn (18 wt%) and 1 wt% of Sn. The results obtained are in agreement with the non-invasive XRF analysis (see table 2, point 3).
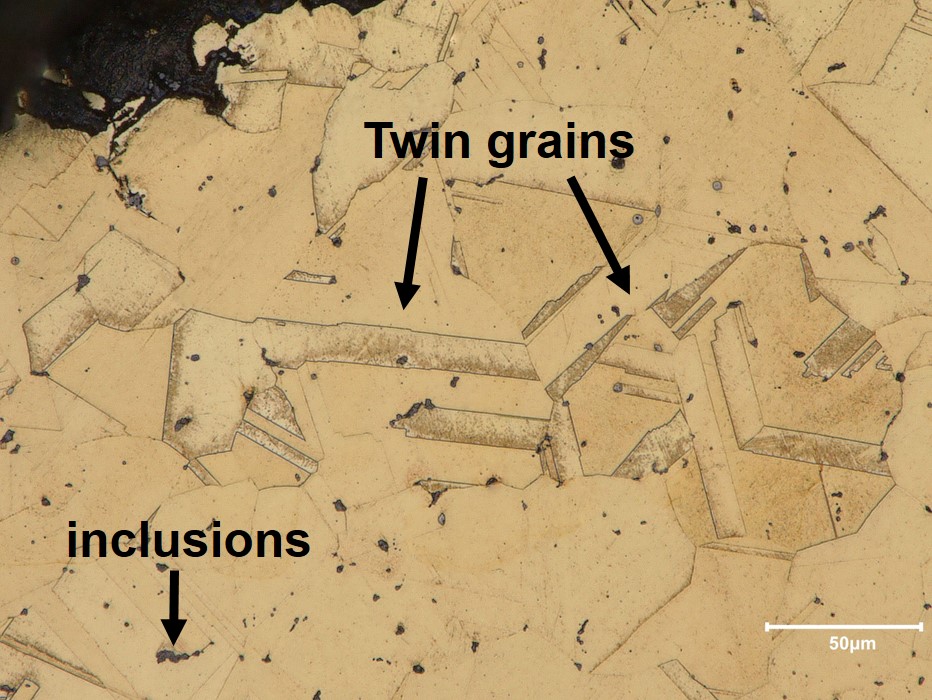
The observation of the metal in cross-section after etching (Fig. 6) shows a microstructure with polygonal grains and several twinned grains (Fig. 7), revealing that the object underwent cold working and annealing. The metal also contains small sulfide inclusions (2-10 µm) for a total of 1% of the metallic surface of the sample in cross-section.
| Elements | wt % |
| Cu | 79 |
| Zn | 18 |
| Sn | 1 |
| Na | 1 |
| Al | <0.5 |
| S | <0.5 |
| Fe | <0.5 |
Table 3: Chemical composition (wt %) of the alloy over a general area of analysis obtained by SEM-EDX, LMC-IRAMAT-CNRS-UTBM.
 Credit LMC-CNRS, V.Valbi.
Polygonal and twinned grains
Cu
Zn, Sn
The presence of Na in the metal is not understood yet.
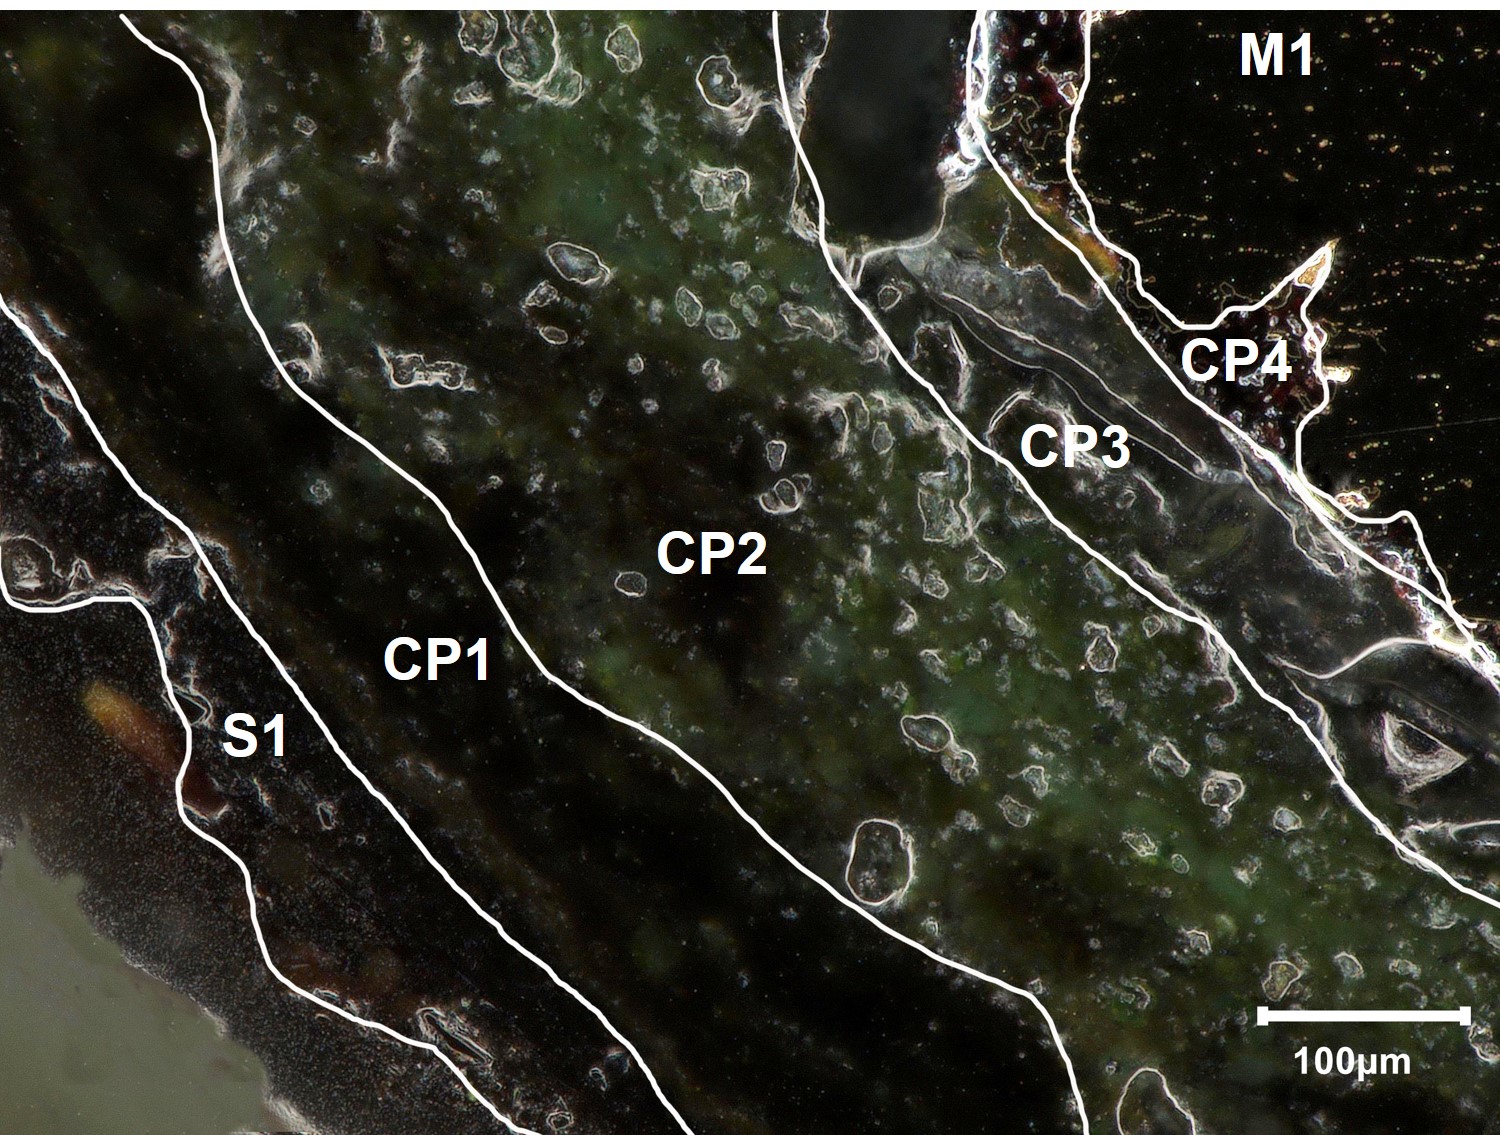
The observation of the sample in cross-section in dark field (Fig. 8) allows to identify an external dark brown 100 µm thick S1 stratum and a dark brown 150 µm thick CP1 stratum, then a green 250 µm thick CP2, a grey 100 µm thick CP3, and a red discontinuous and thin (30-50 µm) CP4 at the interface with the metal (M1).
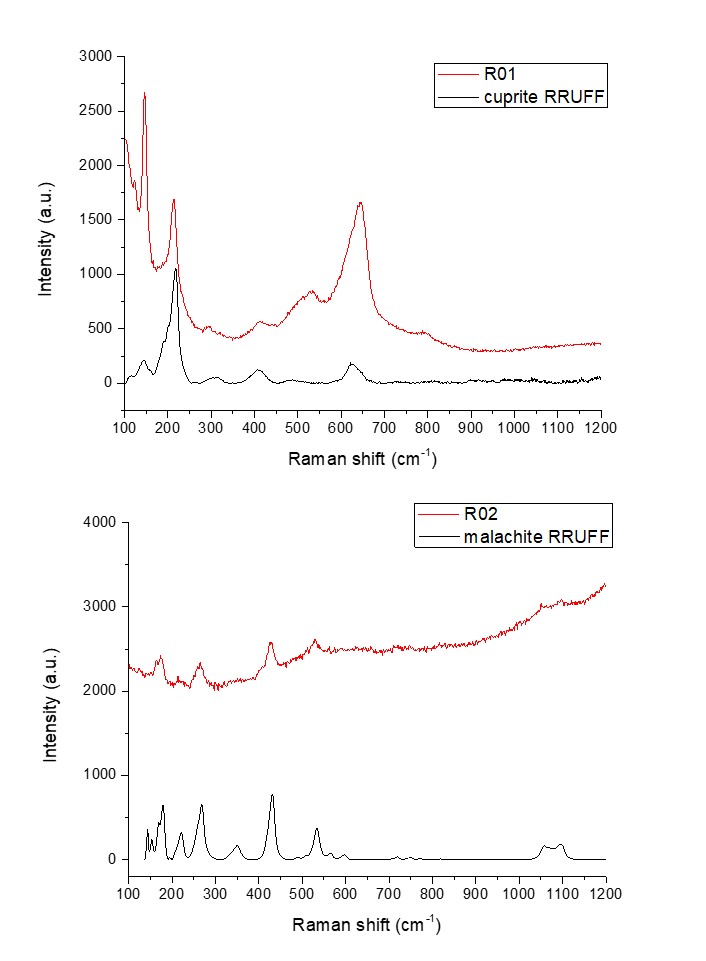
The SEM-EDX analyses (Table 4, Fig. 9) and μ-Raman spectroscopy (Fig. 10) allow to identify the red CP4 (R01) as cuprite (Cu2O). For the CP2, the Raman signal (R02) for malachite (Cu2(CO3)(OH)2) was locally obtained despite the strong fluorescence. The CP1 and CP3 show no Raman signal and it was not possible to clearly identify them. The SEM-EDX reveals a strong enrichment in external elements such as Fe (6 wt%) and P (4 wt%) from the soil for the external dark CP1, while the CP3 shows a strong Sn enrichment (26 wt%). The S1 stratum presents a few alloying elements such as Cu and Sn, as well as external elements such as Ca, Si and Fe, it corresponds to the Transformed Medium (Neff et al. 2004), a transition zone between the Dense Product Layer and the non-altered soil, containing both corrosion products and markers from the soil. These results are in agreement with the preliminary XRF analysis. No significant Cl enrichment is observed.
| wt% | S1 |
CP1 | CP2 | CP3 | CP4 |
| O | 45 | 37 | 34 | 33 | 8 |
| Cu | 7 | 31 | 59 | 24 | 88 |
| Sn | 1 | 11 | 2 | 26 | 1 |
| Zn | 1 | 1 | 1 | 2 | 1 |
| Fe | 6 | 6 | 1 | 5 | n.d. |
| P | 2 | 3 | <0.5 | 2 | n.d. |
| Ca | 5 | 3 | <0.5 | 2 | n.d. |
| Pb | 1 | 1 | <0.5 | 2 | n.d. |
| Si | 29 | 1 | 1 | 2 | <0.5 |
| Cl | 1 | 1 | <0.5 | 1 | <0.5 |
| S | <0.5 | 1 | <0.5 | 2 | <0.5 |
| Al | 2 | <0.5 | n.d. | <0.5 | <0.5 |
Table 4: Chemical composition (wt %) of the corrosion products over a general area of analysis by SEM-EDX (n.d.: below the detection limit), LMC-IRAMAT-CNRS-UTBM.
 Credit LMC-CNRS, V.Valbi.
 Credit LMC-CNRS, V.Valbi.
Uniform
Unknown
The presence of chlorine was not investigated by XRF, but the amount detected on the cross-section is considered insignificant.
Both observations under binocular microscope and in cross-section identified one S stratum and four CPs. Some differences can be noted between the two modes of observation concerning the relative thicknesses and colours of the strata certainly caused by a different interaction of the materials with the light according to the mode of observation, or by the heterogeneity of the corrosion structure on the object. It is interesting to note that the porosity and powdery texture observed under binocular microscope correspond to a dense network of cracks in cross-section.
Under binocular, the CP4 was observed as a nodular structure whereas it appears as a discontinuous layer in cross section. This difference could be related to the observation area.
The earstick is a brass with a medium high amount of Zn (18 wt%) and 1 wt% Sn. The microstructure of the metal shows that the object has been cold worked and annealed.
The observation of the corrosion structure in cross-section allows to locate the original surface of the object at the interface between CP1 and S1. This is in agreement with the binocular observation of surface decoration (surface of CP1) on the twisted part of the earstick. The corrosion structure underneath presents the phenomenon of dezincification commonly observed in brasses, together with a localized decuprification phenomenon. In fact, Zn is almost absent in the whole corrosion structure (1-2 wt%, in contrast with the 18 wt% in the alloy), while Cu is depleted (20-30 wt%, in contrast with the 79 wt% in the alloy) in CP1 and CP3 where a Sn enrichment is observed (10-25 wt%, in contrast with the 1 wt% in the alloy). The Cu-rich CPs were identified as cuprite (CP4) and malachite (CP2). The external dark stratum CP1 is rich in soil elements such as Fe and P.
This artefact is part of a corpus of objects, together with Fibula SMRA 20/19066-10 and Ring SMRA 16/17285-01 which all present a flaking phenomenon of the corrosion products.
References on object and sample
1. Fibula SMRA 20/19066-10.
2. Ring SMRA 16/17285-01.
References on analytical methods and interpretation
3. Lafuente, B., Downs, R. T., Yang, H., Stone, N. (2015) The power of databases: the RRUFF project. In: Highlights in Mineralogical Crystallography, T. Armbruster and R. M. Danisi, eds. Berlin, Germany, W. De Gruyter, 1-30.
4. Papadopoulou, O., Vassiliou, P., Grassini, S., Angelini, E. and Gouda, V. (2016) Soil-induced corrosion of ancient Roman brass – A case study. Materials and Corrosion, 67, 2.
5. Scott, D. (2006) Metallography and microstructure of ancient and historic metals. J Paul Getty Museum Publications.
6. Robbiola L., Blengino M., Fiaud C., (1998) Morphology and mechanisms of formation of natural patinas on archaeological Cu–Sn alloys. Corrosion Science, 40 (12), 2083-2111.
7. Neff D., Reguer S., Bellot-Gurlet L., Dillmann P., Bertholon R. (2004) Structural characterization of corrosion products on archaeological iron: an integrated analytical approach to establish corrosion forms. J. Raman Spectrosc. 35: 739–745.