Coin CdN 2012-1-50
Naima. Gutknecht (HE-Arc CR, Neuchâtel, Neuchâtel, Switzerland) & Valentina. Valbi (Laboratoire Métallurgie et Culture LMC-IRAMAT-CNRS-UTBM, Belfort, Franche-Comté, France) & Rey-Bellet. Bernadette (Musée d'art et d'histoire, Genève, Genève, Geneva, Switzerland)
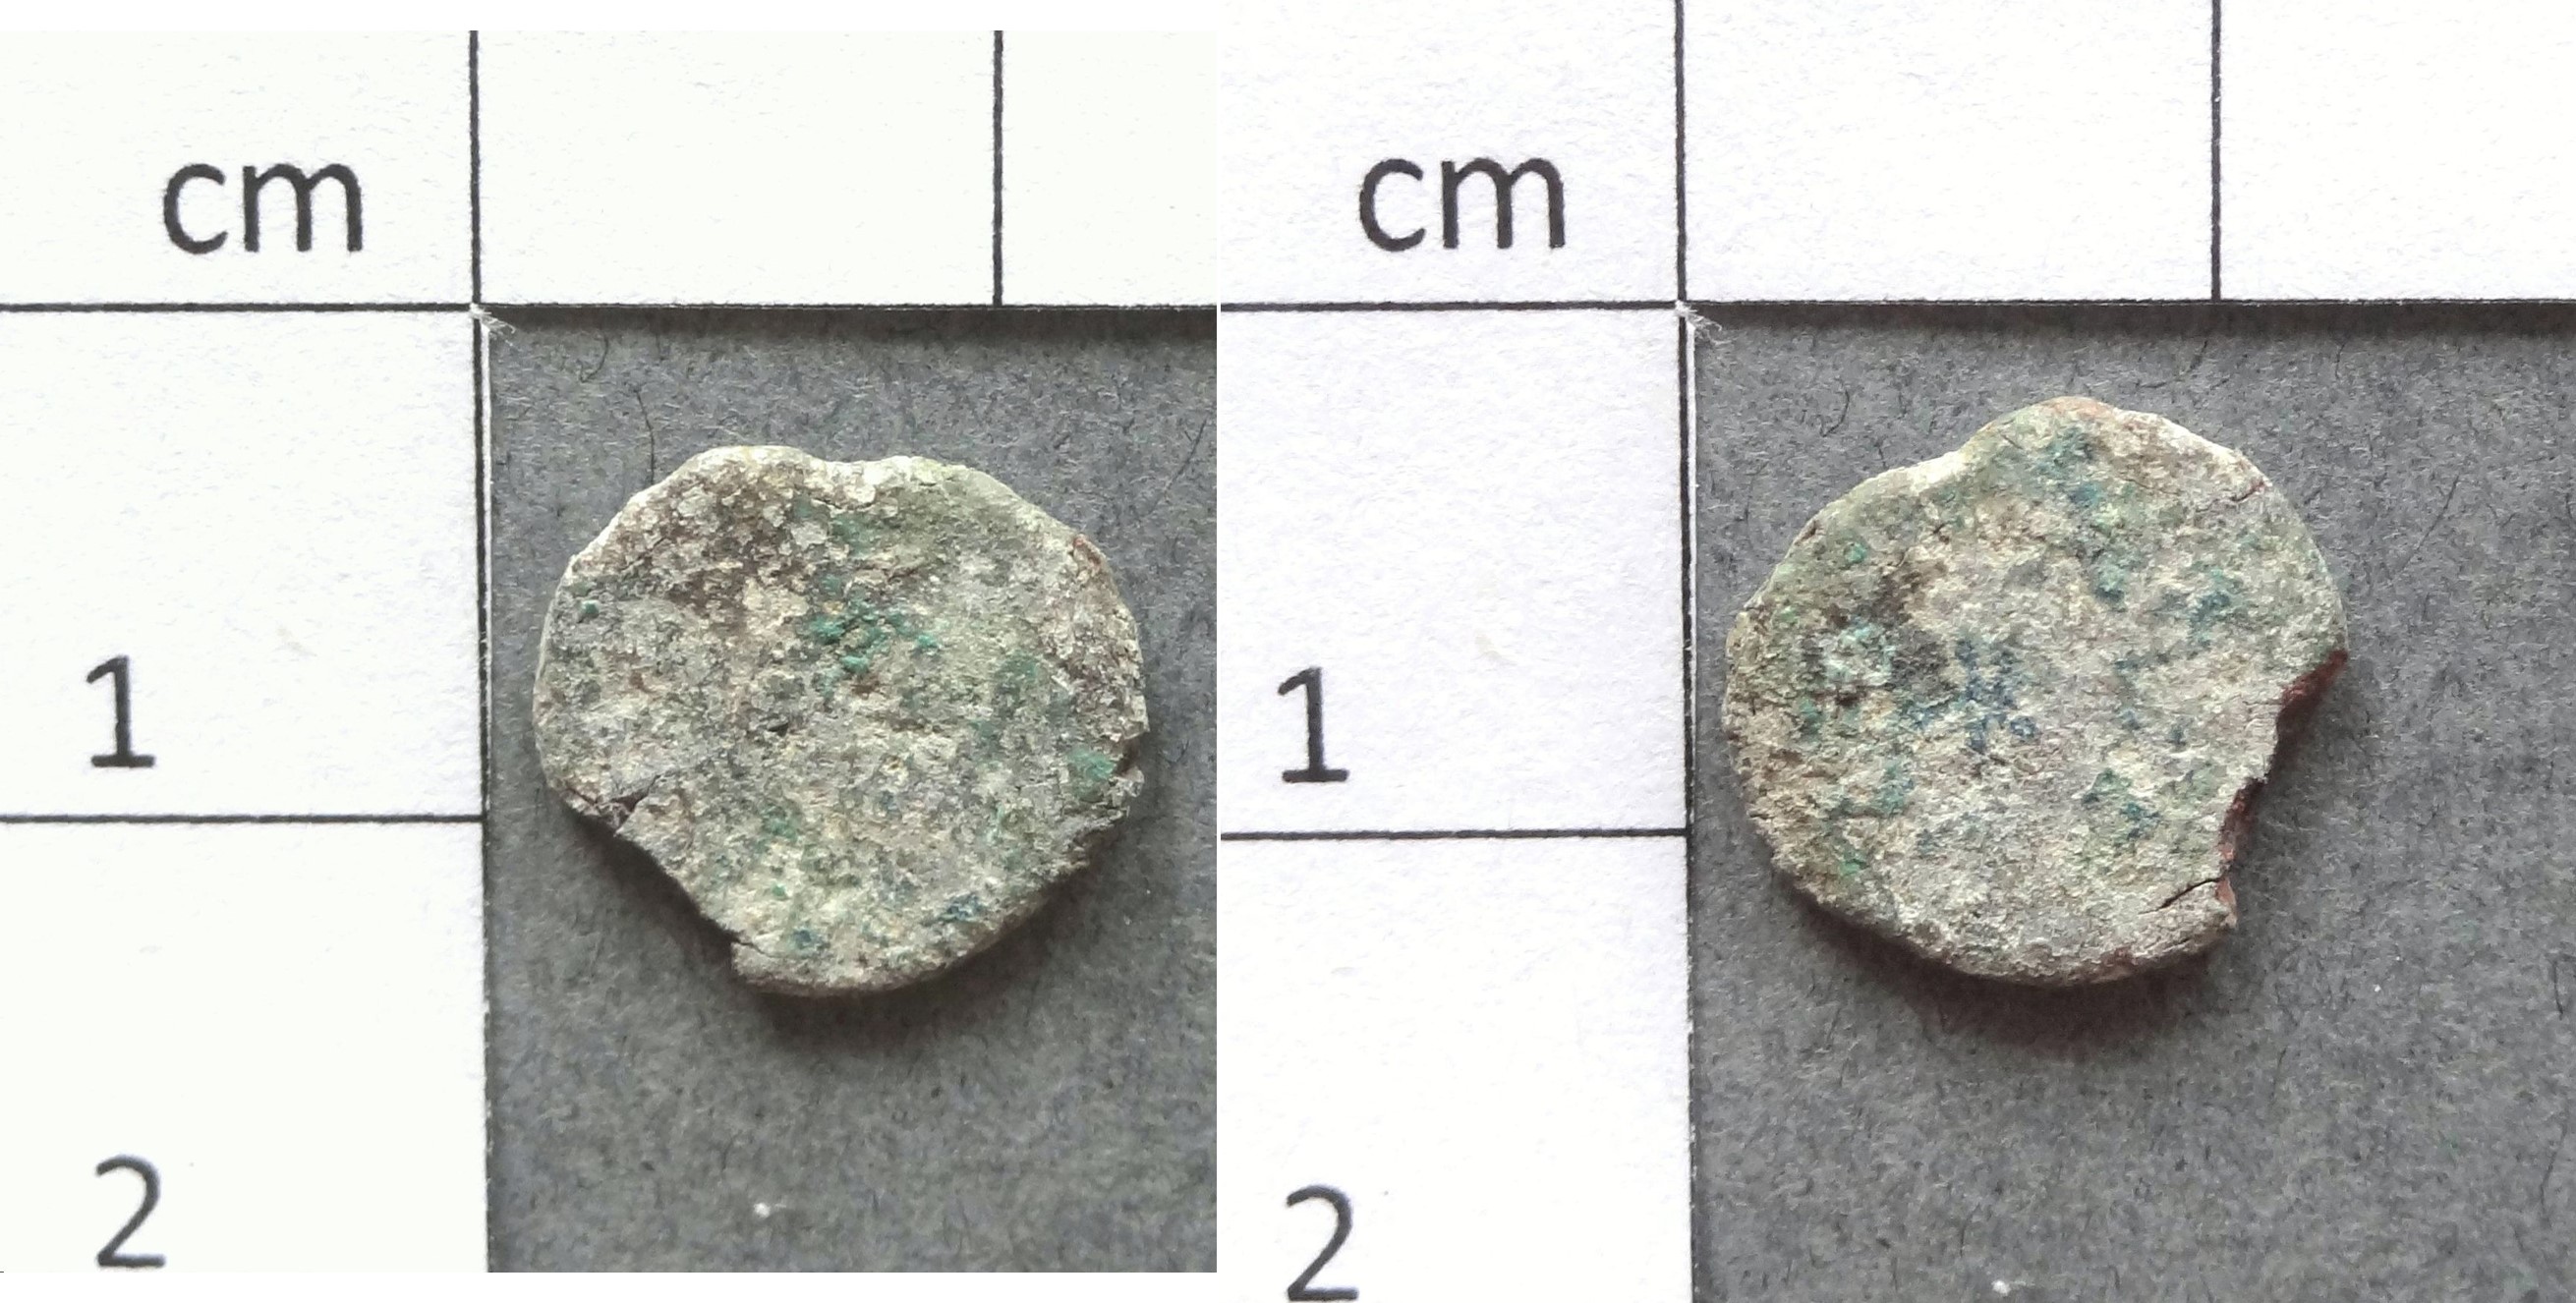
Coin with white, green and blue corrosion products. The coin is probably an imitation. Diameter: about 1.2cm.
coin
Peney, Genève, Geneva, Switzerland
1960
Late roman times
Soil
Musée d'art et d'histoire, Genève, Geneva
Musée d'art et d'histoire, Genève, Geneva
CdN 2012-1-50
No conservation treatment reported
Object recovered in 1960 at Peney, Geneva, Switzerland in a hoard containing 4000 coins. Around 1400 coins from the hoard are conserved at the Art and History Museum of Geneva.
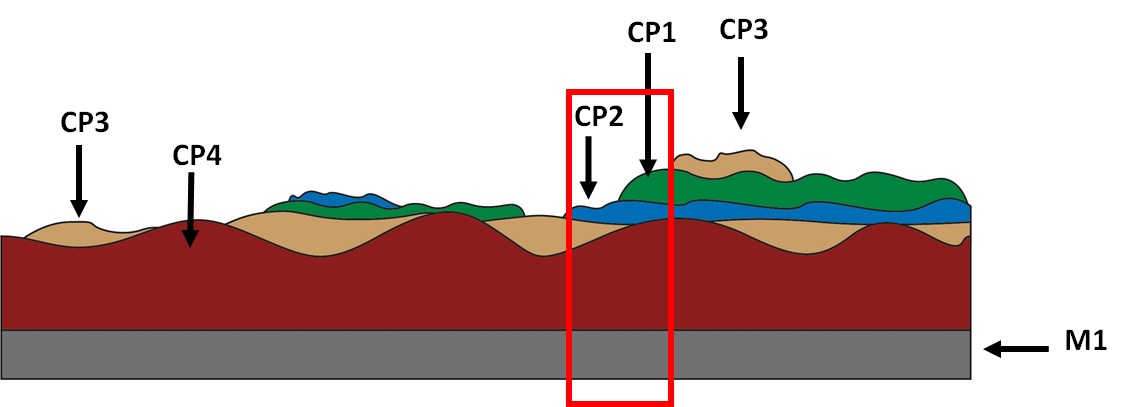
The schematic representation below gives an overview of the corrosion structure encountered on the coin from a first visual macroscopic observation.
| Stratum | Type of stratum | Principal characteristics |
| CP1 | Corrosion product | Layer, dark green, thin, scattered, compact, soft |
| CP2 | Corrosion product | Layer, blue, thin, scattered, compact, soft |
| CP3 | Corrosion product | Layer, light brown, thin, discontinuous, non-compact, soft |
| CP4 | Corrosion product | Layer, dark red, thick, continuous, compact, very soft |
| M1 | Metal | Grey, metallic, soft |
Table 1: Description of the principal characteristics of the strata as observed under binocular microscope according to Bertholon's method.
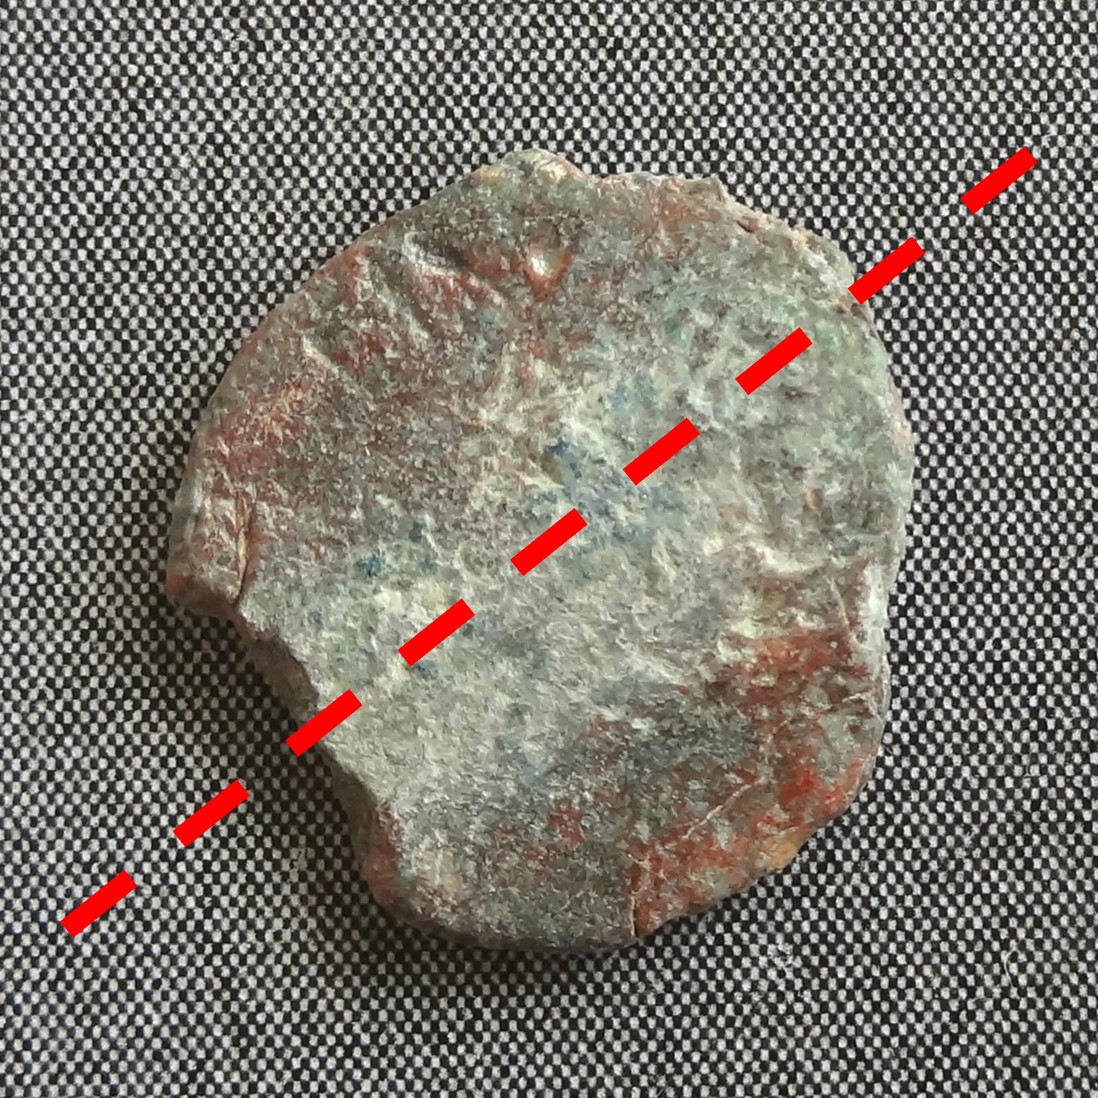
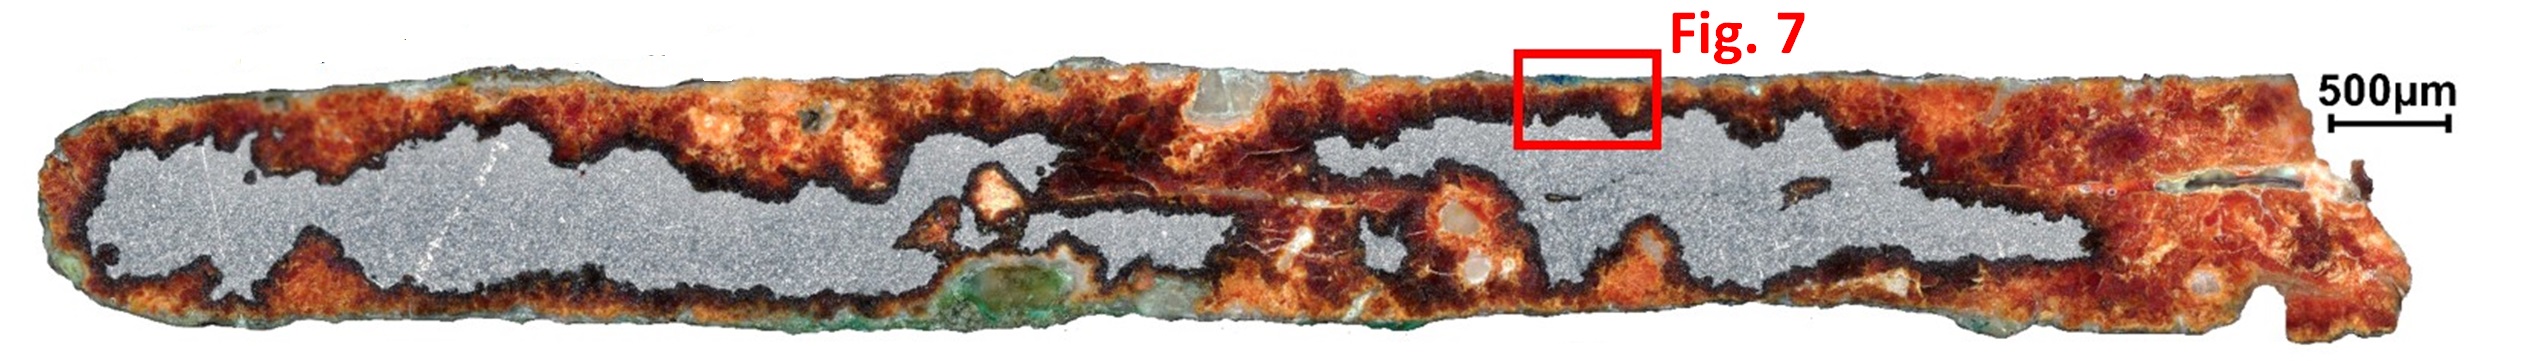
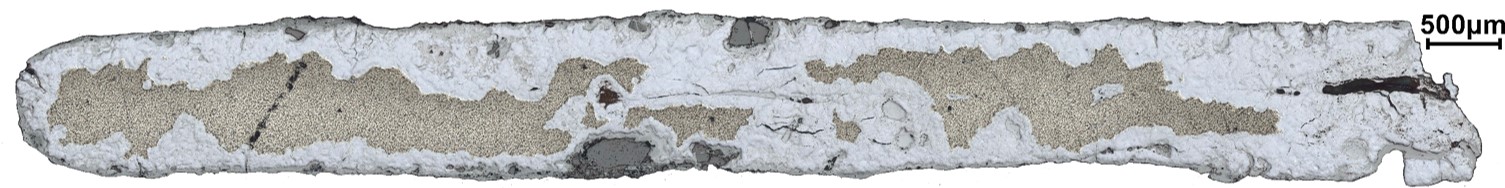
The cross-section corresponds to a cut of the coin in half (Fig. 2) and is representative of the entire thickness of the coin's body. A metallic core is present below the corrosion layers (Fig. 6).
Pb alloy
None
B50
Musée d'art et d'histoire, Genève, Geneva
Musée d'art et d'histoire, Genève, Geneva
June 2021
None.
Analyses performed:
Non-invasive approach
- XRF with handheld portable X-ray fluorescence spectrometer (NITON XL3t 950 Air GOLDD+, Thermo Fischer®). General Metal mode, acquisition time 60s (filters: Li20/Lo20/M20).
Invasive approach (on the sample)
- Optical microscopy: the sample is polished, then it is observed on a numerical microscope KEYENCE VHX-7000 in bright and dark field.
- Metallography: the polished sample is etched with alcoholic ferric chloride and observed by optical microscopy in bright field.
- SEM-EDS: the sample is coated with a carbon layer and analyses are performed on a SEM-FEG JEOL 7001-F equipped with a silicon-drift EDS Oxford detector (Aztec analysis software) with an accelerating voltage of 20 kV and probe current at about 9 nA. The relative error is considered of about 10% for content range <1mass%, and of 2% for content range of >1mass%.
- µ-Raman spectroscopy: it is performed on a HORIBA Labram Xplora spectrometer equipped with a 532 nm laser with 1800 grating, the laser power employed is between 0.04 and 0.55 mW with acquisition time varying between 1 and 5 minutes.
The XRF analysis of coin CdN 2012-1-50 was carried out before sampling. All strata, from soil and corrosion products to metal, are analyzed at the same time. The metal is presumably a copper-lead-tin alloy, while the other elements detected (Si, P) are from the environment.
| Elements | mass % |
| Pb | 84 |
| Cu | 10 |
| Sn | 1 |
| Si | <1 |
| P | <1 |
Table 2: Chemical composition of the surface of coin CdN 2012-1-50. Method of analysis: XRF, General Metal mode, acquisition time 60s (filters: Li20/LO20/M20). The results are rounded up to the nearest whole number, UR-Arc CR.
EDX analysis of the residual metal on cross-section indicates that this coin is made of almost pure lead (Table 3). An horizontal central crack can be observed on the right side of the sample, as well as in the middle of the sample, leading to a more advanced corrosion. This crack could be a sign of a not completed welding of the object obtained by folding of a lead sheet.
| Elements | wt% |
| Pb | 93 |
| Sn | 0.5 |
| Cu | <0.5 |
Table 3: Chemical composition (wt%) of the alloy over a general area of analysis, LMC-IRAMAT-CNRS-UTBM.
It was not possible to perform metallographic analysis of the residual metal.
None
Pb
None.
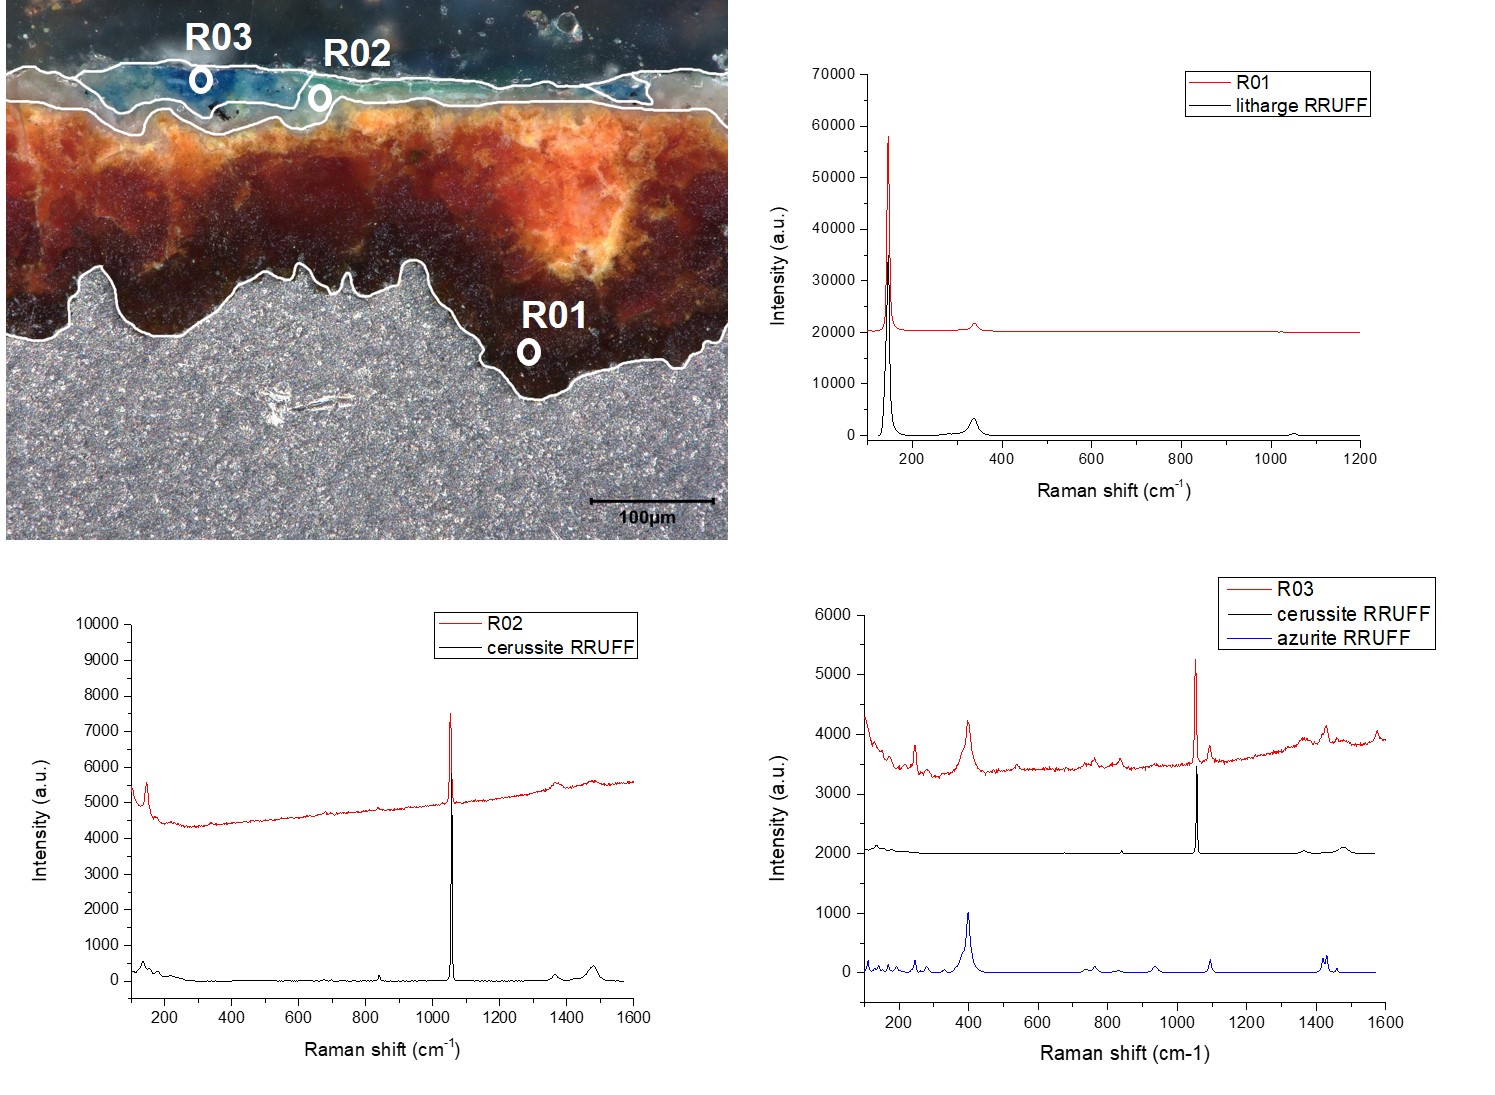
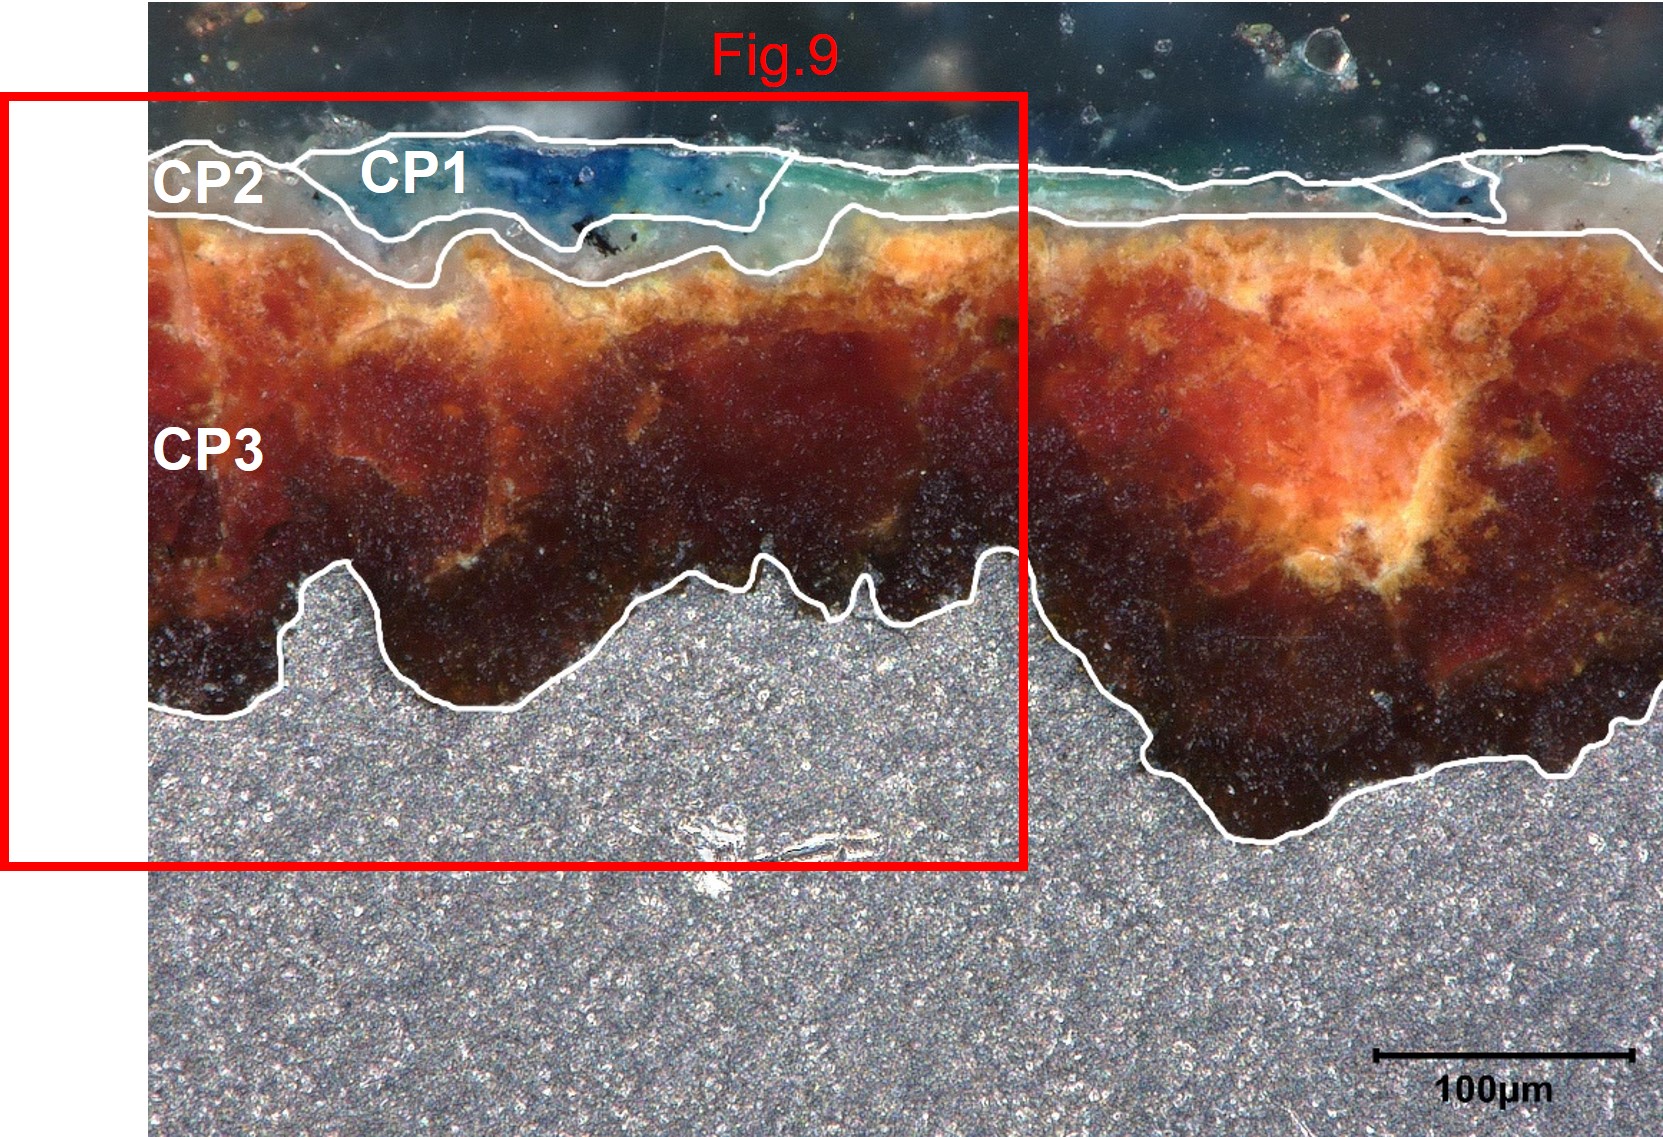
The observation of the sample in dark field mode (Fig.8) shows the presence of an external discontinuous blue CP1 layer, a white CP2 layer and a thick internal red/orange CP3 layer.
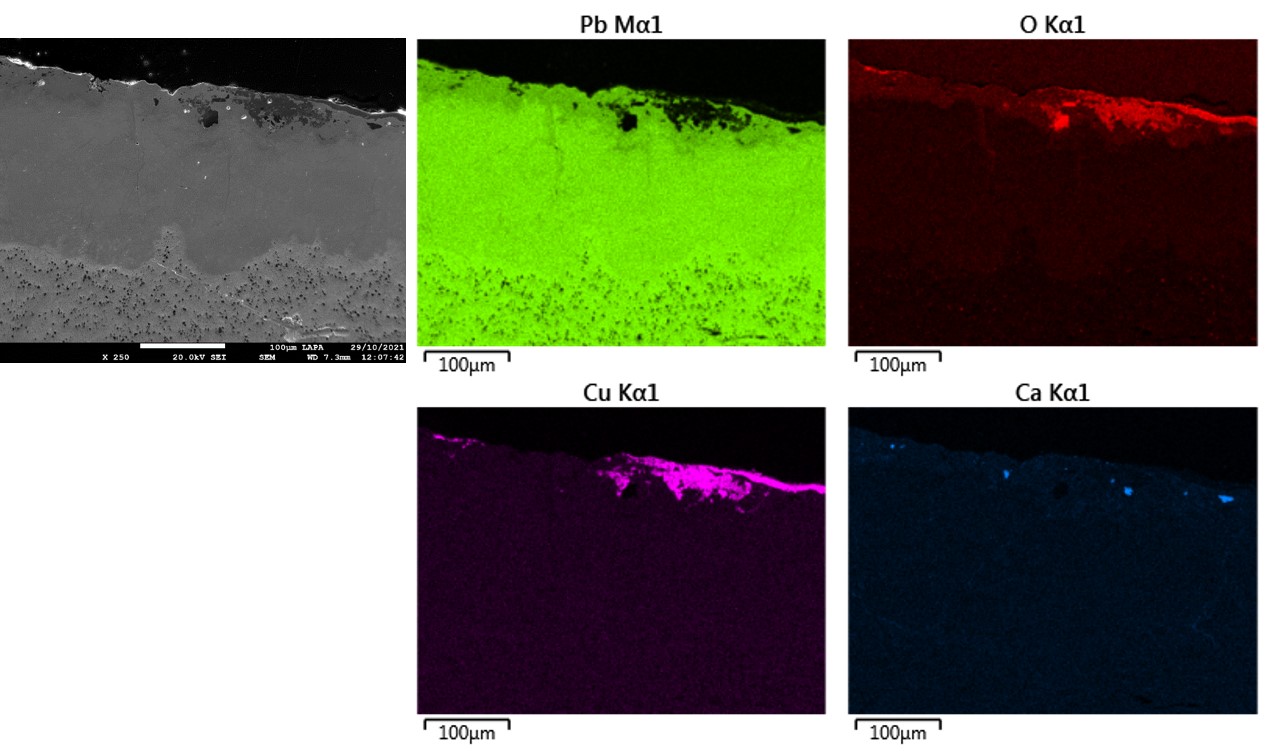
The EDX elemental analysis (Table 4, Fig.8) of the visually identified CPs by cross-sectional observation (Fig. 7) shows that the external CP1 is a Cu-based compound, while the white CP2 and the orange CP3 are lead-based corrosion products.
µ-Raman analyses were performed on the identified strata (Fig. 9). The Raman spectrum obtained on the blue CP1 layer corresponds to the one of azurite (Cu3(CO3)2(OH)2). The Raman spectrum obtained on the white CP2 corresponds to cerussite (PbCO3), while the orange/red CP3 layer corresponds to litharge (PbO).
| Elements | CP1 | CP2 | CP3 |
| O | 28 | 14 | 6 |
| Si | < 0.5 | < 0.5 | < 0.5 |
| P | < 0.5 | n.d. | n.d. |
| Ca | < 0.5 | 1 | n.d. |
| Cu | 64 | 2 | < 0.5 |
| Sn | 1 | n.d. | 1 |
| Pb | 6 | 83 | 93 |
| Total | 100 | 100 | 100 |
Table 4: Chemical composition (wt %) of the corrosion layers over a general area of analysis in cross-section (n.d.: below the detection limit), LMC-IRAMAT-CNRS-UTBM.
 Credit LMC-CNRS, V.Valbi.
 Credit LMC-CNRS, V.Valbi.
Uniform
None
None.
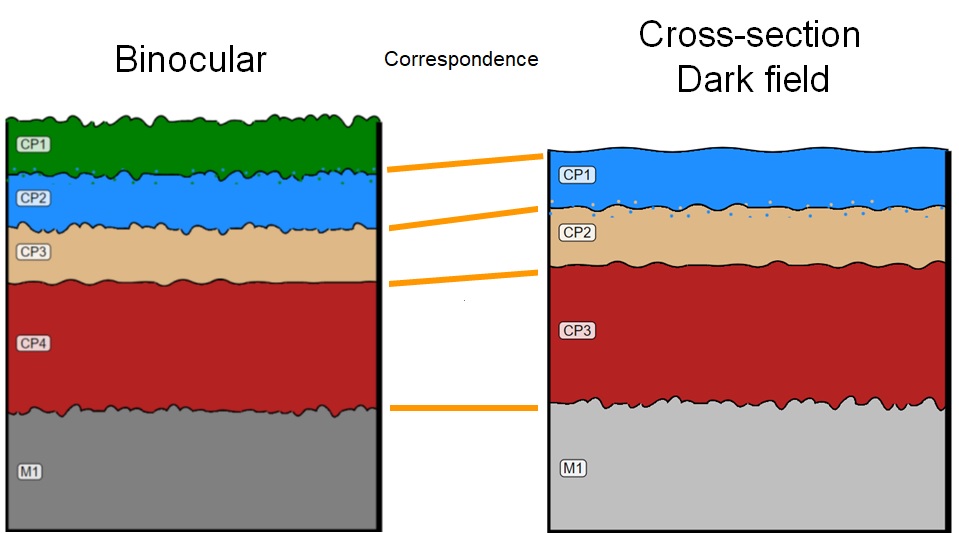
The stratigraphies obtained by binocular and cross-section observation show a few differences that can be attributed to the different scales of observation and can be easily compared.
The green CP1 observed by binocular is not present in the CS stratigraphy even though a light green coloration can be observed on the external white stratum in Fig.8, which was not interpreted as a separate layer because it did not correspond to a significant difference in composition. However, the green coloration can be seen more clearly in other parts of the sample (Fig.5) and is in fact documented by binocular, which allows to build a stratigraphy representative of the whole object.
For the rest of the corrosion structure, a direct correspondence can found. The blue CP2 observed by binocular corresponds to the blue azurite CP1 observed by CS, the light brown CP3 observed by binocular corresponds to the white/brown cerussite CP2 in CS, the red thick CP4 by binocular corresponds to the orange/dark brown litharge CP3 in CS.
This coin is made of almost pure lead and shows typical lead corrosion products, litharge lead oxide and cerussite lead carbonate. The blue external stratum of azurite, as well as the green stratum (presumably malachite), are probably a pollution from adjacent Cu-based coins belonging to the same treasury. Two other coins from the same corpus are documented in MiCorr, they both are made of Cu-based alloys, and azurite and malachite were present as corrosion products.
References on object and sample
1. MiCorr_Coin CdN 2012-1-55
2. MiCorr_Coin CdN 2012-1-57
References on analytical methods and interpretation
3. Lafuente, B., Downs, R. T., Yang, H., Stone, N. (2015) The power of databases: the RRUFF project. In: Highlights in Mineralogical Crystallography, T. Armbruster and R. M. Danisi, eds. Berlin, Germany, W. De Gruyter, 1-30.
4. Scott, D. (2006) Metallography and microstructure of ancient and historic metals. J Paul Getty Museum Publications.
5. Švadlena J., Prošek T., Strachotová KC., Kouřil M. (2020). Chemical Removal of Lead Corrosion Products. Materials, 12 (24), 5672.
6. Quaranta M., Catelli E., Prati S., Sciutto G., Mazzeo R. (2014) Chinese archaeological artefacts: Microstructure and corrosion behaviour of high-leaded bronzes. Journal of Cultural Heritage, 15 (3), 283-291.