Fitting on back panel of a military carriage
Marianne. Senn (EMPA, Dübendorf, Zurich, Switzerland) & Christian. Degrigny (HE-Arc CR, Neuchâtel, Neuchâtel, Switzerland)
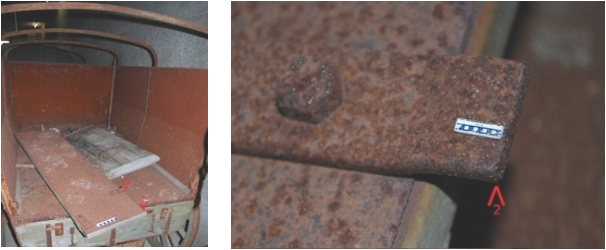
Fitting on back panel, first exposed outdoors, later indoors (Fig. 1). Uniform corrosion and pitting corrosion are visible.
Military carriage
Swiss Army, Thun, Bern, Switzerland
Built by Konstruktions-Werkstätte, 1918
Modern Times
1918
Outdoor to indoor atmosphere
Historical Swiss Army Material Foundation, Burgdorf, Bern
Historical Swiss Army Material Foundation, Burgdorf, Bern
n.a.
Not conserved
Nothing to report.
Stratigraphic representation: none.
This sample is a cut from the corner of one of the two fittings on the back panel (Fig. 2). The metal is covered by a thin corrosion layer (Fig. 3).
Thomas steel
Piled from several strips, hot rolled and annealed
POINT-Fe2
Empa (Marianne Senn)
Historical Swiss Army Material Foundation, Burgdorf, Bern
05/2009 metallography
Nothing to report.
Analyses performed:
Metallography (nital etched after etching with Oberhoffer’s reagent), Vickers hardness testing, LA-ICP-MS, SEM/EDS.
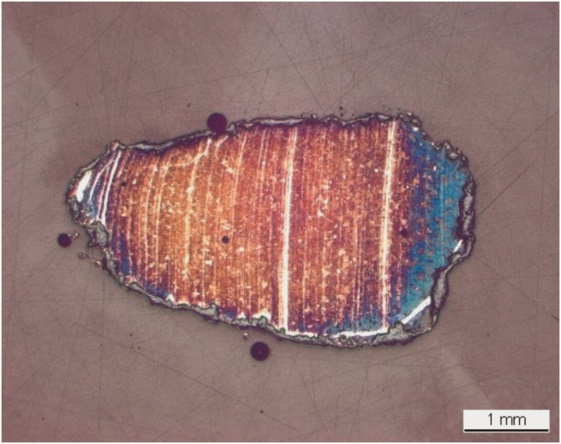
The remaining metal is a Mn-rich soft steel (C content around 0.1 mass%) containing manganese sulphide inclusions with a varying Fe content (Tables 1 and 2). The numerous inclusions form parallel rows (Fig. 5). This orientation is typical for hot rolled metal. After etching with Oberhoffer’s reagent, three main welding seams (P-rich) become visible (Fig. 6). Near the surface they are also outlined by corrosion (Figs. 5 and 11). After nital etching, the metal shows a ferritic structure with tertiary cementite and lamellar pearlite at the grain boundaries (Figs. 7 and 8). The grains are small with an ASTM grain size of 10 and are recrystallized due to annealing after hot rolling. The average hardness of the metal is HV1 165. The hardness is slightly high for such a structure and this is due to the Mn content of the metal. The chemical composition, especially the Mn content and the presence of carbo-nitrides (not analysed here), is typical for Thomas steel.
| Elements | Ni/Co | Al | P | Ti | V | Cr | Mn | Co | Ni | Cu | As | Mo | Ag | Sn | Sb | W | C* mass% |
|---|---|---|---|---|---|---|---|---|---|---|---|---|---|---|---|---|---|
| Median (mg/kg) | 2.4 | < | 300 | < | < | 140 | 3600 | 200 | 480 | 140 | 700 | 10 | < | 10 | 10 | < | <0.1 |
| Detection Limit (mg/kg) | 5 | 82 | 10 | 2 | 13 | 2 | 1 | 3 | 1 | 3 | 3 | 1 | 1 | 1 | 4 | ||
| RSD % | 1 | - | 8 | - | - | 3 | 7 | 2 | 1 | 6 | 3 | 7 | - | 7 | 8 | - |
*visually estimated
Table 1: Chemical composition of the metal. Method of analysis: LA-ICP-MS. Lab Inorganic Chemistry, ETH.
|
Elements |
S | Mn | Fe | Cu | Total |
|---|---|---|---|---|---|
| Inclusions | 26 | 46 | 31 | 2.2 | 105 |
Table 2: Chemical composition (mass %) of the inclusions. Method of analysis: SEM/EDS, Laboratory of Analytical Chemistry, Empa.
 Credit HE-Arc CR.
 Credit HE-Arc CR.
 Credit HE-Arc CR.
Recrystallized grain structure with tertiary cementite
Fe
C, Mn
Nothing to report.
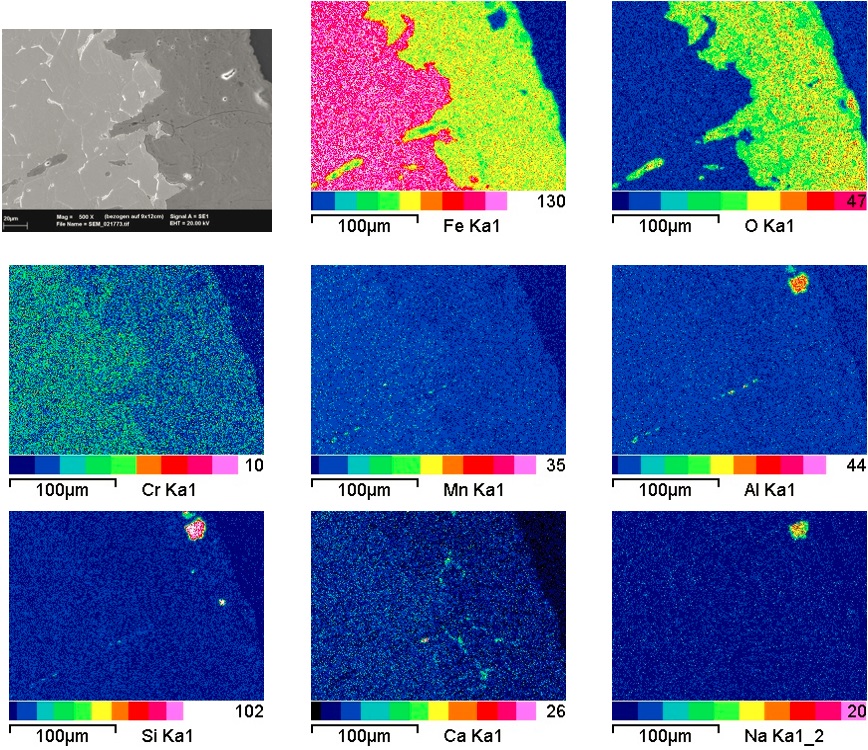
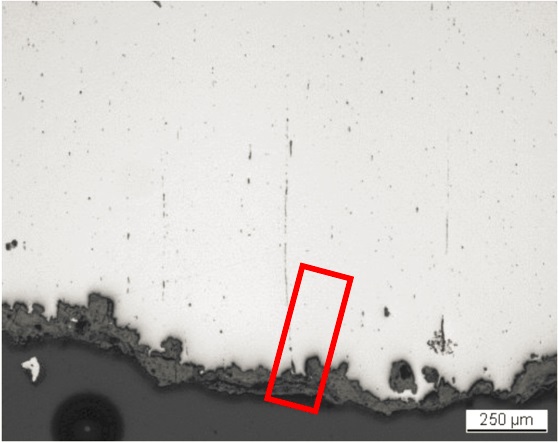
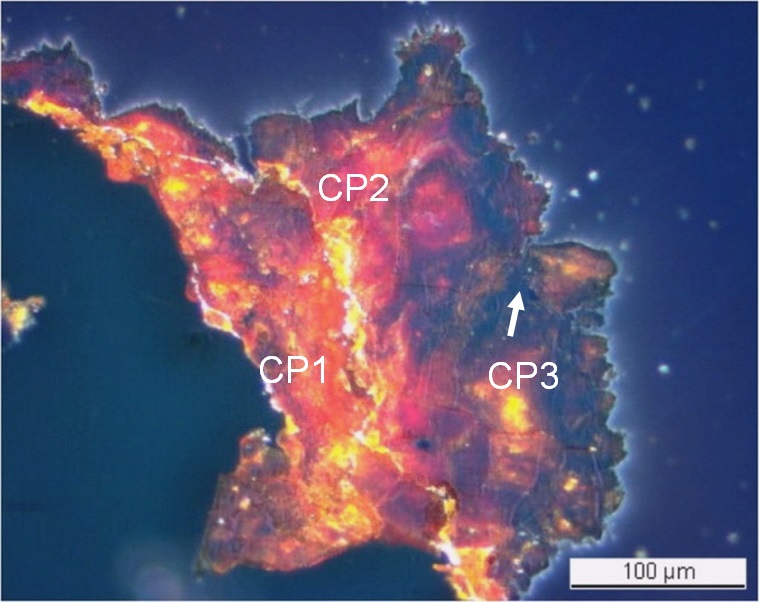
The average thickness of the corrosion products is about 80µm (Figs. 5 and 9). In bright field they appear grey, marbled and heavily cracked (Fig. 9). Under polarised light, the corrosion products appear orange to dark-brown (Fig. 10). At the metal - corrosion products interface they are dark-brown (CP3). The middle part (CP2) is red-orange and the outer part is bright orange (CP1). The elemental mapping of the corrosion layers shows no distinctive stratification, but areas near the metal - corrosion crust interface (CP3) as well as the top surface of the corrosion layer (CP1) seem to have a lower O content (Fig. 11). The O content indicates the presence of iron hydroxides (Table 3). Soil materials (such as rock fragments and dust) are found in the welding seams near the surface.
|
Elements Location |
O
|
S
|
Mn
|
Fe
|
Total
|
|---|---|---|---|---|---|
| In welding seam | 34 | < | < | 67 | 102 |
| Inner corrosion layer (CP3) | 38 | 0.7 | 0.8 | 66 | 106 |
Table 3: Chemical composition (mass %) of the corrosion layer (from Fig. 11). Method of analysis: SEM/EDS, Laboratory of Analytical Chemistry, Empa.
 Credit HE-Arc CR.
 Credit HE-Arc CR.
Uniform - transgranular
?
Nothing to report.
Corrected stratigraphic representation: none.
The fitting was produced from Mn-containing Thomas steel. It was forged out of four strips, hot rolled and annealed. The corrosion contains only few external markers such as sand grains and dust particles in the outermost layers. The presence of soil materials in the welding seams near the surface could be due either to the corrosion progress (by diffusion through the corrosion crust) or to the manufacturing process.
|
References on object and sample |
|
References object References sample |
|
References on analytic methods and interpretation |
|
ASTM E112-13: Standard Test Methods for Determining Average Grain Size. |