Fragment of a bed structure 03 12751-20.2.5
Marianne Senn. (Empa, None) & Christian. Degrigny (HE-Arc CR, Neuchâtel, Neuchâtel, Switzerland)
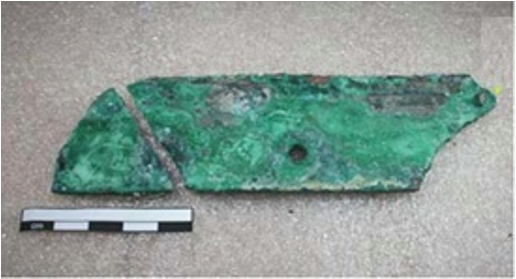
Fragment from a series of 9 elements of a Roman bed structure, covered with green-black corrosion products (Fig. 1). The metal underneath is decorated with incrustations (Ag and Cu) representing meanders and olive branches. An intentional black patina might have been applied on the ancient surface to contrast it with the silver and pink coloured inlays.
Furniture element
"Palais de Derrière la Tour", Avenches, Vaud, Switzerland
Excavation 2003
Roman Times
Second half of the 2nd Century AD
Soil
Roman museum, Avenches, Vaud
Roman museum, Avenches, Vaud
03/12751-20.2.5
Not conserved
Nothing to report.
Stratigraphic representation: none.
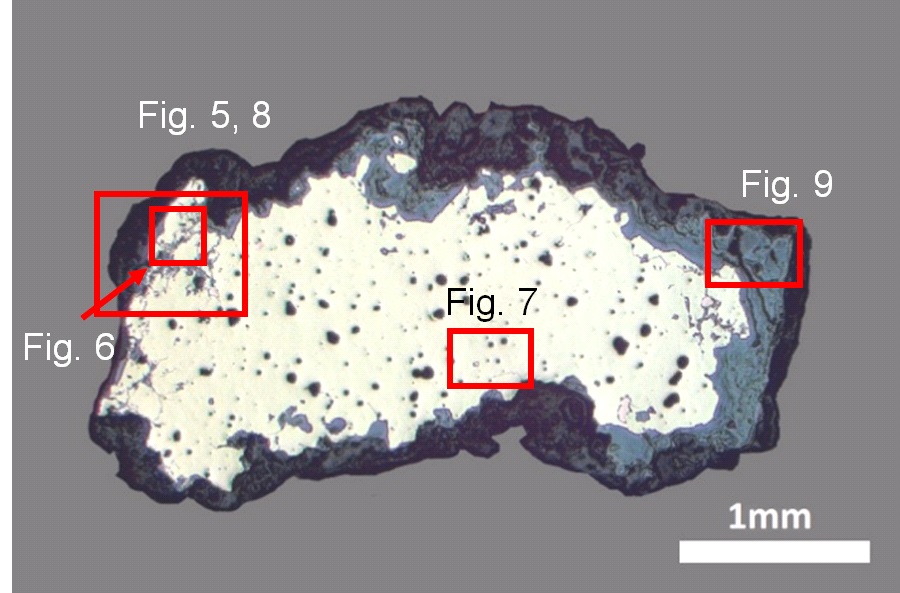
The sample is a section from the fragment represented on Fig. 2. The remaining metal is surrounded by a thick corrosion crust (Fig. 3). Its dimensions are: L = 3.5mm and W = 1.5mm.
Tin Bronze
Partly annealed after cold working
HECR-MK5
HE-Arc CR, La Chaux-de-Fonds, Neuchâtel
HE-Arc CR, La Chaux-de-Fonds, Neuchâtel
2008-2009, analyses of the corrosion products
Nothing to report.
Analyses performed:
Metallography (etched with ferric chloride reagent), Vickers hardness testing, SEM/EDS, XRD, Raman spectroscopy.
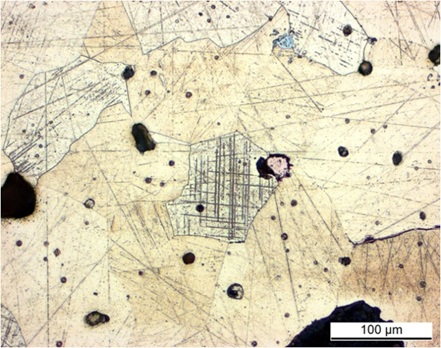
The remaining metal is a porous tin bronze (Table 1) with tiny iron oxides inclusions (Table 2) and secondary re-deposited copper. Intergranular corrosion has developed locally inside the metal (Figs. 5 and 6). The etched alloy shows a structure principally consisting of large polygonal grains, some of which include strain lines (Fig. 7). Locally an isolated alpha + delta eutectoid can be seen. Much smaller twinned grains can be found on the left side of the sample (Fig. 6). The average hardness of the metal is HV1 100. However on the left side of the sample, where the grains are smaller and twinned, the hardness is much higher (more cold work followed by annealing).
| Elements | Cu | Sn | Fe |
|---|---|---|---|
| mass% | 82.0 | 13.0 | ? |
Table 1: Chemical composition of the metal. Method of analysis: SEM/EDS, Lab of Electronic Microscopy and microanalysis, IMA (Néode), HEI Arc.
|
Elements |
O | Mn | Fe | Cu | Sn | Total |
|---|---|---|---|---|---|---|
| Inclusions | 23 | 0.7 | 64 | 8.7 | 1.8 | 99 |
Table 2: Chemical composition (mass %) of the tiny inclusions on Fig. 5. Method of analysis: SEM/EDS, Laboratory of Analytical Chemistry, Empa.
 Credit HE-Arc CR.
 Credit HE-Arc CR.
Large and small polygonal grains with few twins + strain lines
Cu
Sn
Nothing to report.
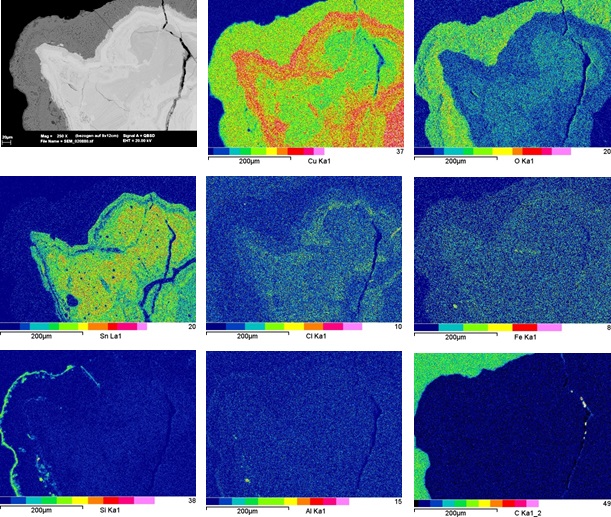
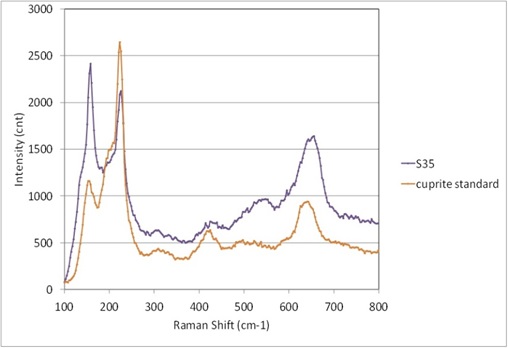
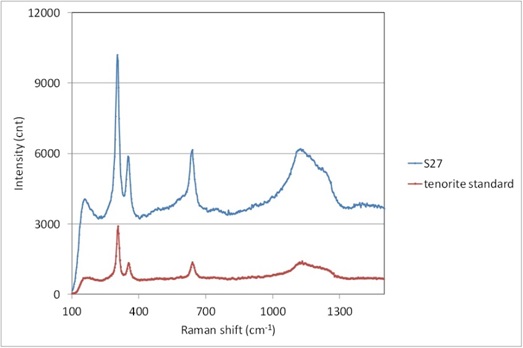
The metal - corrosion products interface is irregular (Fig. 3) and the average thickness of the corrosion crust is 300μm. The latter can be divided into four layers (Fig. 5). In bright field, the inner layer (CP4) is medium grey and dense. In polarised light it is dark-red/orange (Fig. 8). It is Sn-rich, contains O and Cl but is Cu depleted (Table 3 and Fig. 9). The next layer (CP3) is as well medium grey in bright field and light-red in polarised light. It has a composition similar to cuprite/Cu2O (Table 3). This was confirmed by Raman spectroscopy (Fig. 10). The third layer (CP2) is thin, is light grey in bright field and contains black pores. Under polarised light it looks brilliant black (Fig. 8) and is rich in Cu with Sn and O (Fig. 9). Using XRD, it was identified as a mixture of tenorite/CuO, cuprite/Cu2O and cassiterite/SnO2 (Krieg 2009). Raman spectroscopy could only detect tenorite in this layer (Fig. 11). In bright field the thick outer layer (CP1) is marbled in dark-grey and black, in polarised light it appears blue-green (Fig. 8). XRD analysis gave a composition close to malachite/Cu2CO3(OH)2 (Krieg 2009). In the present study no C was detected (Fig. 9), but Raman spectroscopy confirmed its presence (Fig. 12). The spectrum obtained shows a good match with published spectra (Bouchard and Smith 2003). Peaks are similar to those expected for malachite but most of them have a Raman shift: 3322, 1503, 1108, 1073, 759, 731, 603, 540, 442, 357, 276, 225, 186, 163 cm-1. The underlined Raman shifts correspond to the peaks of greatest intensity. Environmental elements such as Si are concentrated on the top surface (Fig. 9).
|
Elements |
O | Cu | Sn | Si | Cl | Mn | Fe | Pb | Total |
|---|---|---|---|---|---|---|---|---|---|
| CP3, red outer edge of the inner corrosion layer (average of 2 similar analyses) | 19 | 69 | 5.1 | 0.7 | < | < | < | < | 94 |
| CP4, dark-orange inner corrosion layer (average of 3 similar analyses) | 25 | 52 | 25 | 0.9 | 0.6 | < | < | 1.0 | 104 |
Table 3: Chemical composition (mass %) of the corrosion crust from Fig. 8. Method of analysis: SEM/EDS, Laboratory of Analytical Chemistry, Empa.
 Credit HE-Arc CR.
Fig. 8: Micrograph showing the metal - corrosion crust interface from Fig. 3 (detail of Fig. 5) and corresponding to the stratigraphy of Fig. 4, polarised light. From bottom left to to right: In grey the metal, in dark-red/orange CP4, in light red CP3, in black (with pores) CP2 and in green-blue CP1,
 Credit Empa.
 Credit SNM.
Fig. 10: Raman spectrum of CP3 (S35) from Fig. 8 compared to a cuprite standard spectrum. Settings: laser wavelength 532nm, acquisition time 20s, one accumulation, filter D2 (0.75-0.8mW), hole 1000, slit 100, grating 600. Method of analysis: Raman spectroscopy, Lab of Swiss National Museum, Affoltern a. Albis ZH,
 Credit SNM.
Fig. 11: Raman spectrum of the black layer (CP2) with pores (S27) from Fig. 8 compared to a tenorite standard spectrum. Settings: laser wavelength 532nm, acquisition time 100s, one accumulation, filter D1 (7.5-8mW), hole 500, slit 80, grating 600. Method of analysis: Raman spectroscopy, Lab of Swiss National Museum, Affoltern a. Albis ZH,
 Credit SNM.
Fig. 12: Raman spectrum of the green outer corrosion layer (CP1) from Fig. 8. Settings: laser wavelength 532nm, acquisition time 80s, one accumulation, filter D2 (0.75-0.8mW), hole 500, slit 80, grating 600. Method of analysis: Raman spectroscopy, Lab of Swiss National Museum, Affoltern a. Albis ZH,
Uniform - intergranular
Type I or II ? (Robbiola)
Nothing to report.
Corrected stratigraphic representation: none.
One side of the tin bronze artefact has been repeatedly annealed after cold working whereas the rest of the metal was cold worked. The metal is covered with a terrestrial type corrosion layer. Cl is found in proximity to the metal in a Sn-rich but Cu-depleted inner area of the first cuprite layer. It is followed by an intermediate thin layer composed of a mixture of tenorite and tin oxides. The third voluminous layer is malachite. These results confirm Krieg’s conclusions (Krieg 2009). Since the bed fragments have been excavated from a burnt down house, it is difficult to judge if the tenorite is an intentional black patina or if it is the result of heating during the fire. The limit of the original surface is outlined by the clear demarcation of Sn content (internal marker) in the first two corrosion layers and can be located between layers 2 & 3. Intentional or no, the black tenorite/cassiterite layer most likely represents the surface that will retain most surface details. In this case, the corrosion type is difficult to attribute after Robbiola et al. 1998.
|
References on object and sample |
|
Reference object Reference sample |
|
References on analytic methods and interpretation |
| 6. Bouchard, M., Smith, D.C. (2003) Catalogue of 45 reference Raman spectra of minerals concerning research in art history or archaeology, especially on corroded metals and coloured glass. Spectrochimica Acta, Part A 59, 2247-2266. 7. Robbiola, L., Blengino, J-M., Fiaud, C. (1998) Morphology and mechanisms of formation of natural patinas on archaeological Cu-Sn alloys, Corrosion Science, 40, 12, 2083-2111. |