Bracelet bus-na 98 BZ 67
Naima. Gutknecht (HE-Arc CR, Neuchâtel, Neuchâtel, Switzerland) & Valentina. Valbi (Laboratoire Métallurgie et Culture LMC-IRAMAT-CNRS-UTBM, Belfort, Franche-Comté, France)
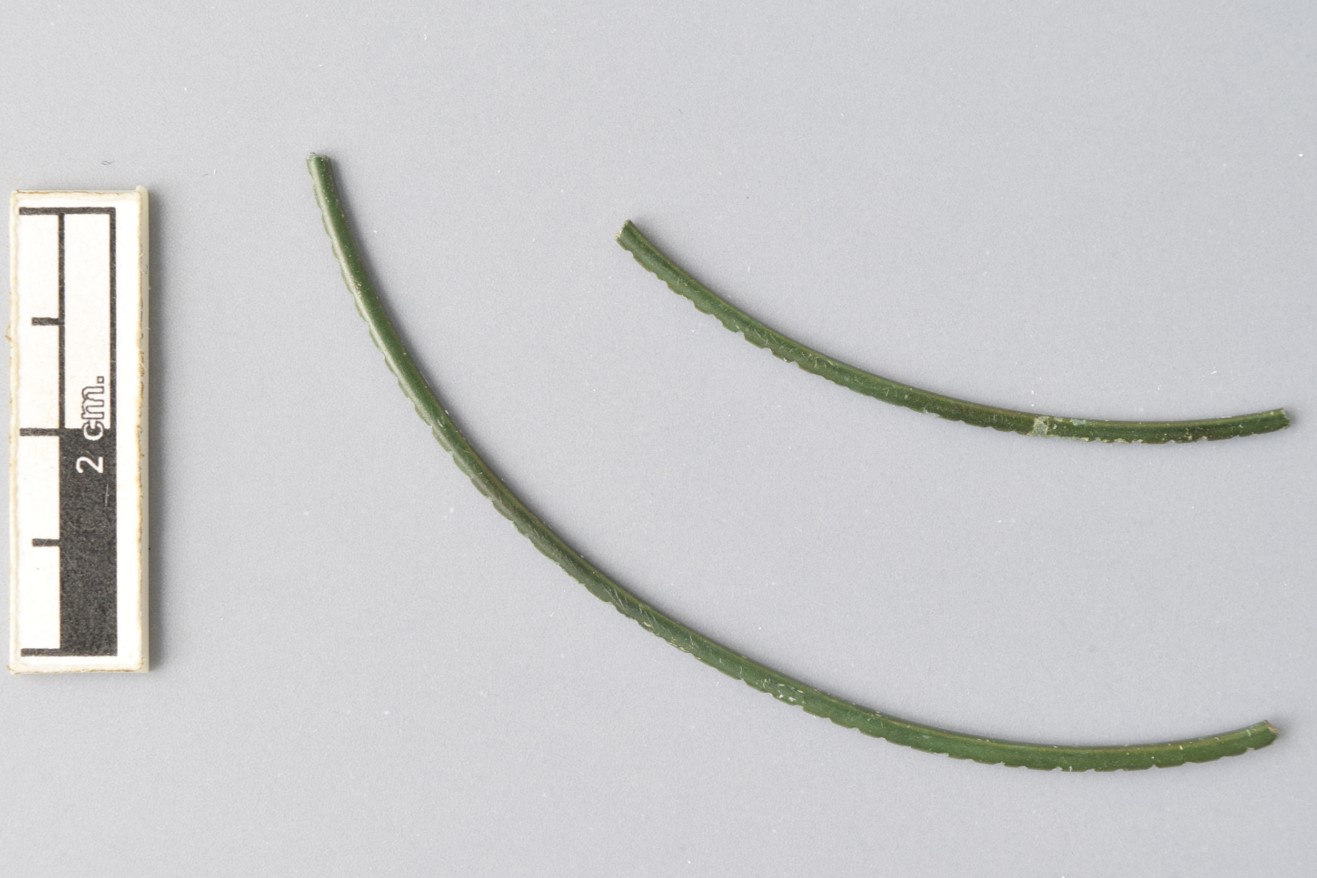
Fragments of a bracelet with curvature (Fig. 1); internal surface of the curvature with a central rib and hammer marks; external surface of the curvature with decorative incisions; round section.
Jewellery
Bussy/Pré de Fond, Fribourg, Fribourg, Switzerland
1998
Iron Age
First Iron Age - Hallstatt Culture (Ha D2-3)
Soil
Archaeological Service of the Fribourg Canton, Fribourg
Archaeological Service of the Fribourg Canton, Fribourg
bus-na 98 BZ 67
Mechanical cleaning of the external corrosion products and soils
This bracelet is part of a corpus of four bracelets (bracelets bus-na 98 BZ 11 / bus-na 98 BZ 23 / bus-na 98 BZ 38 / bus-na 98 BZ 67) found on the same site.
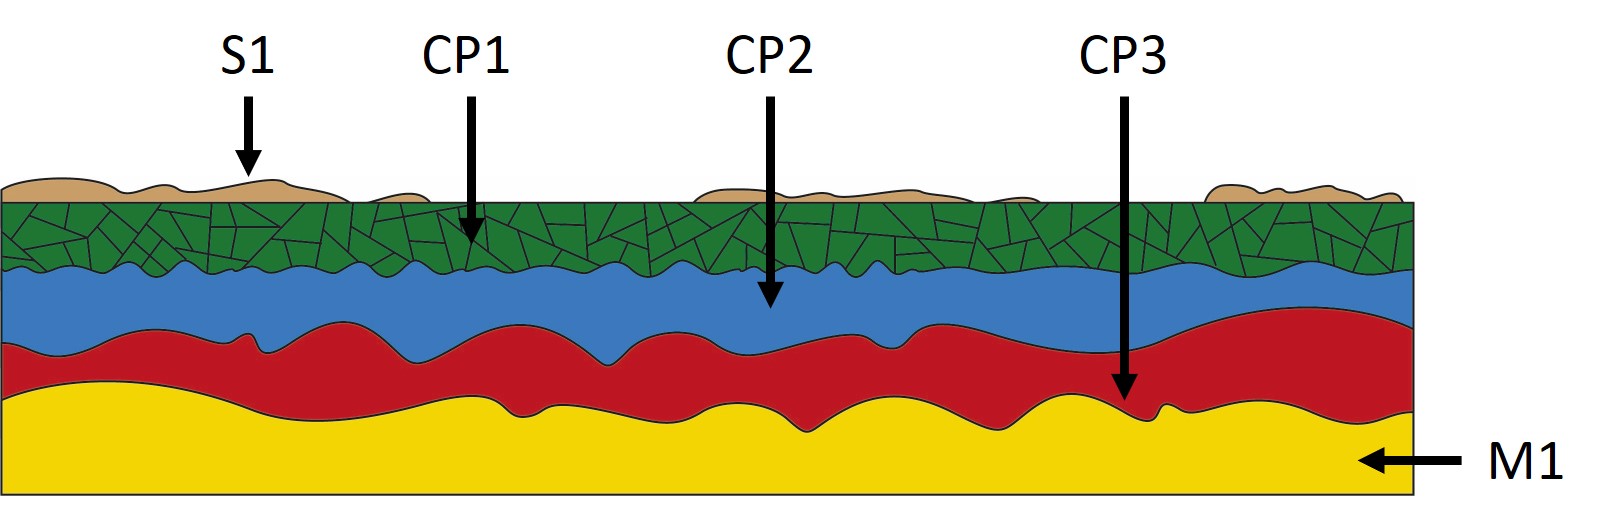
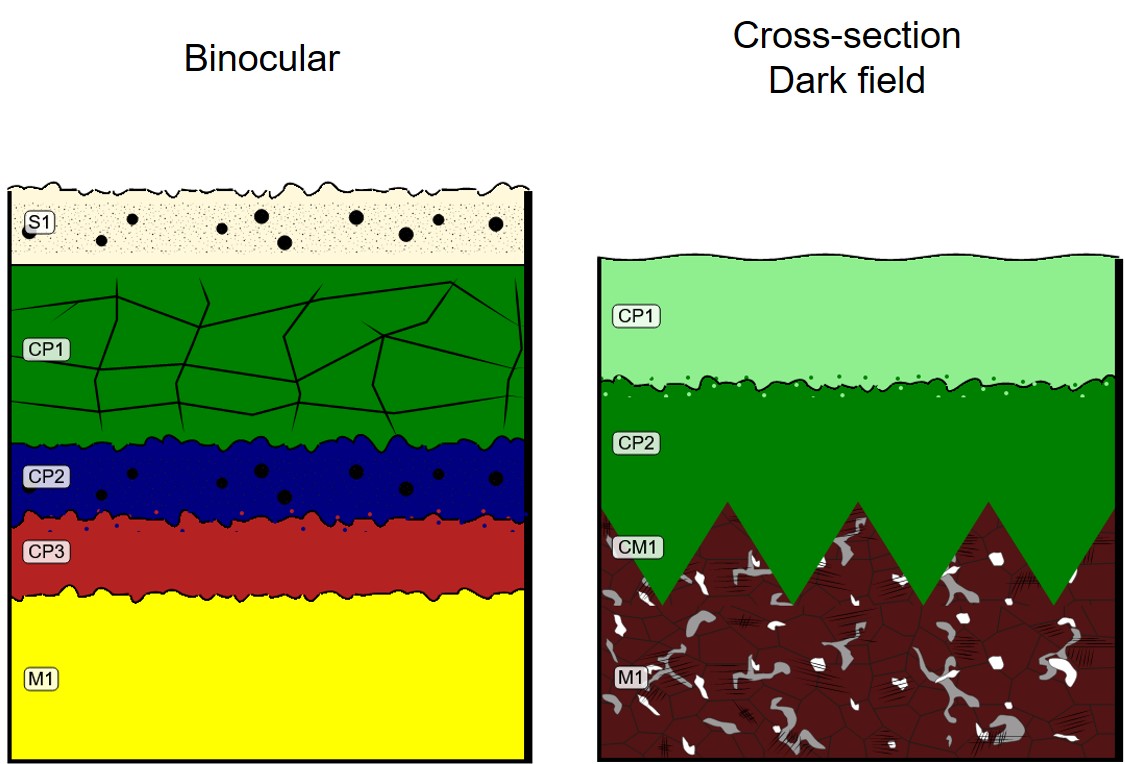
The schematic representation below gives an overview of the corrosion structure encountered on the bracelet from a first visual macroscopic observation.
| Strata | Type of stratum | Principal characteristics |
| S1 | Soil | light yellow, thin, non-compact, powdery |
| CP1 | Corroded product | dark green, thick, discontinuous, compact, hard, network cracks |
| CP2 | Corroded product | dark blue, thin, discontinuous, non-compact, very soft |
| CP3 | Corroded product | dark red, thin, continuous, compact, soft |
| M1 | Metal | yellow, metallic, compact, soft |
Table 1: Description of the principal characteristics of the strata as observed under binocular and described according to Bertholon's method.
The transition between CP3 and the metal M1 is irregular. CP1 shows a network of cracks on the whole stratum.
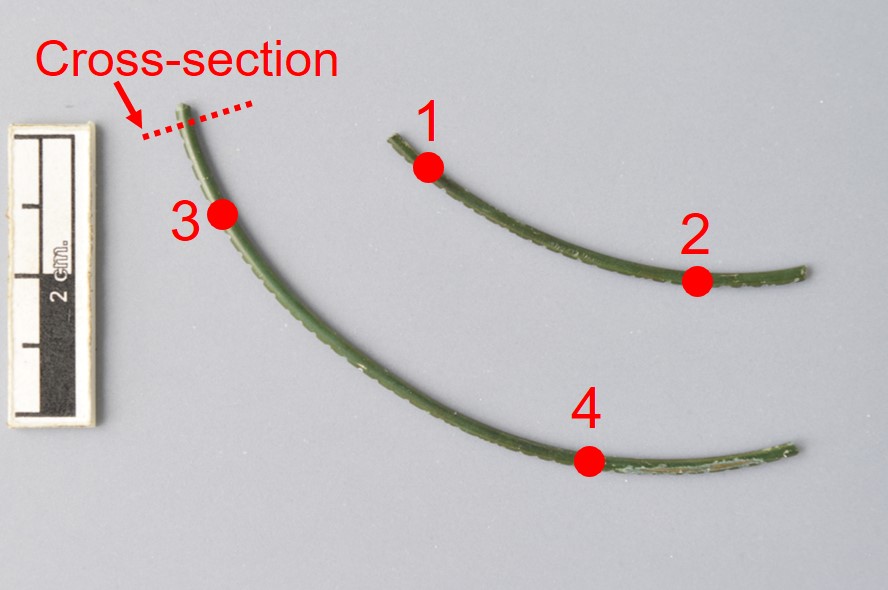
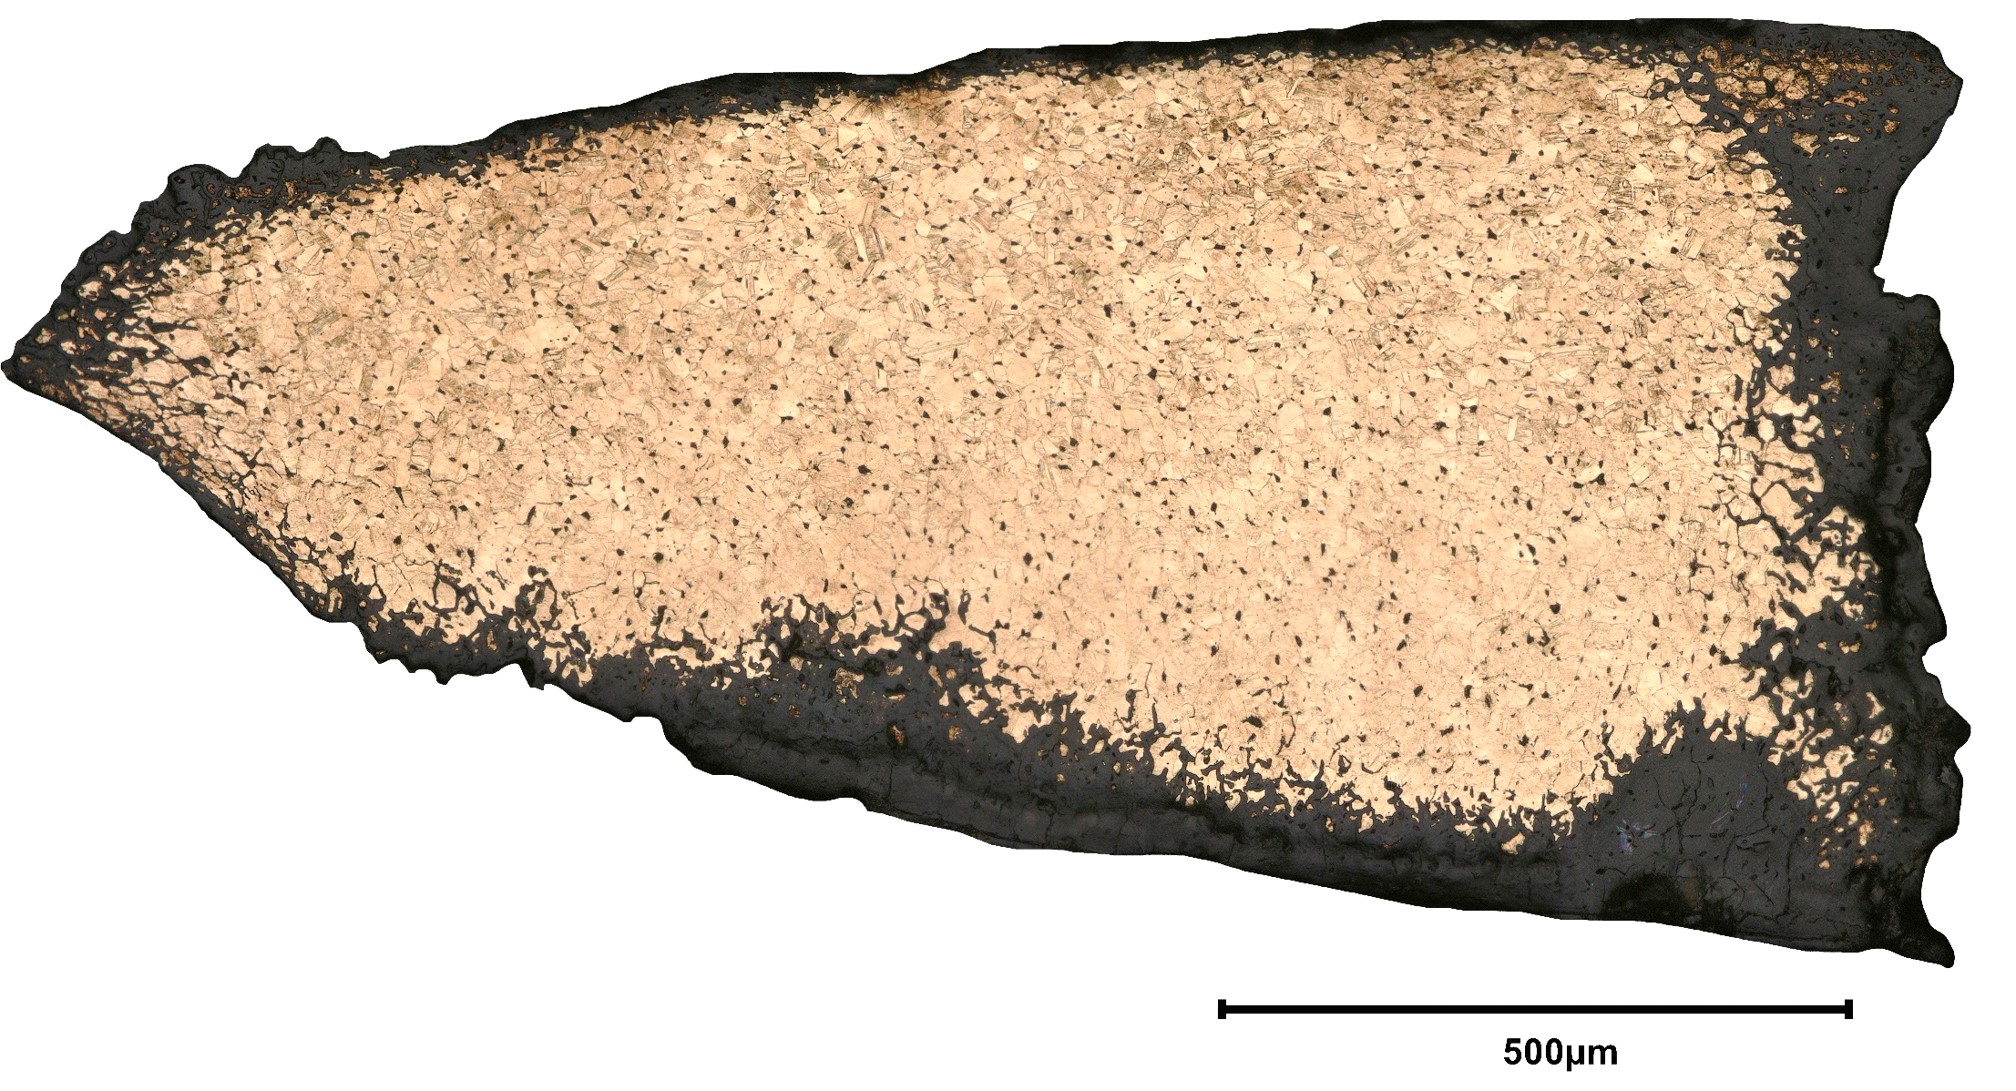
The cross-section corresponds to a lateral cut (Fig. 2) and is representative of the entire thickness of the bracelet's body. A metallic core is present below the corrosion layers (Fig. 6)
Bronze
Cold worked with repeated annealing and final cold working
ébauche 67
Archaeological Service of the Fribourg Canton, Fribourg
Archaeological Service of the Fribourg Canton, Fribourg
February 2020. Metallographic study.
None.
Analyses performed:
Non-invasive approach
- XRF with handheld portable X-ray fluorescence spectrometer (NITON XL3t 950 Air GOLDD+, Thermo Fischer®). General Metal mode, acquisition time 60s (filters: Li20/Lo20/M20).
Invasive approach (on the sample)
- Optical microscopy: the sample is polished, then it is observed on a numerical microscope KEYENCE VHX-7000 in bright and dark field.
- Metallography: the polished sample is etched with alcoholic ferric chloride and observed by optical microscopy in bright field.
- SEM-EDS: the sample is coated with a carbon layer and analyses are performed on a SEM-FEG JEOL 7001-F equipped with a silicon-drift EDS Oxford detector (Aztec analysis software) with an accelerating voltage of 20 kV and probe current at about 9 nA. The relative error is considered of about 10% for content range <1mass%, and of 2% for content range of >1mass%.
- µ-Raman spectroscopy: it is performed on a HORIBA Labram Xplora spectrometer equipped of a 532 nm laser with 1800 grating, the laser power employed is between 0.04 and 0.55 mW with acquisition time varying between 1 and 5 minutes.
The XRF analysis of the bracelet was carried out before sampling on four areas on the two fragments (Fig. 2). All strata (soil, corrosion products, and metal) are analyzed at the same time. The metal is presumably a copper-tin alloy with some lead, while the other elements detected (Si, Al) are from the burial environment.
| Elements (mass %) | 1 | 2 | 3 | 4 |
| Cu | 45 | 44 | 46 | 50 |
| Sn | 36 | 36 | 34 | 30 |
| Pb | 7 | 7 | 9 | 9 |
| Si | 8 | 8 | 9 | 9 |
| Al | >2 | 53 | 3 | 3 |
Table 2: Chemical composition of the surface of the bracelet at four representative points shown in Fig.2. Method of analysis: XRF. The results are rounded up to the nearest whole number.
EDX analysis (Table 3) of the residual metal on cross-section indicates that it is a high tin bronze (14 mass% Sn) with a high percentage of Pb (4 mass%).
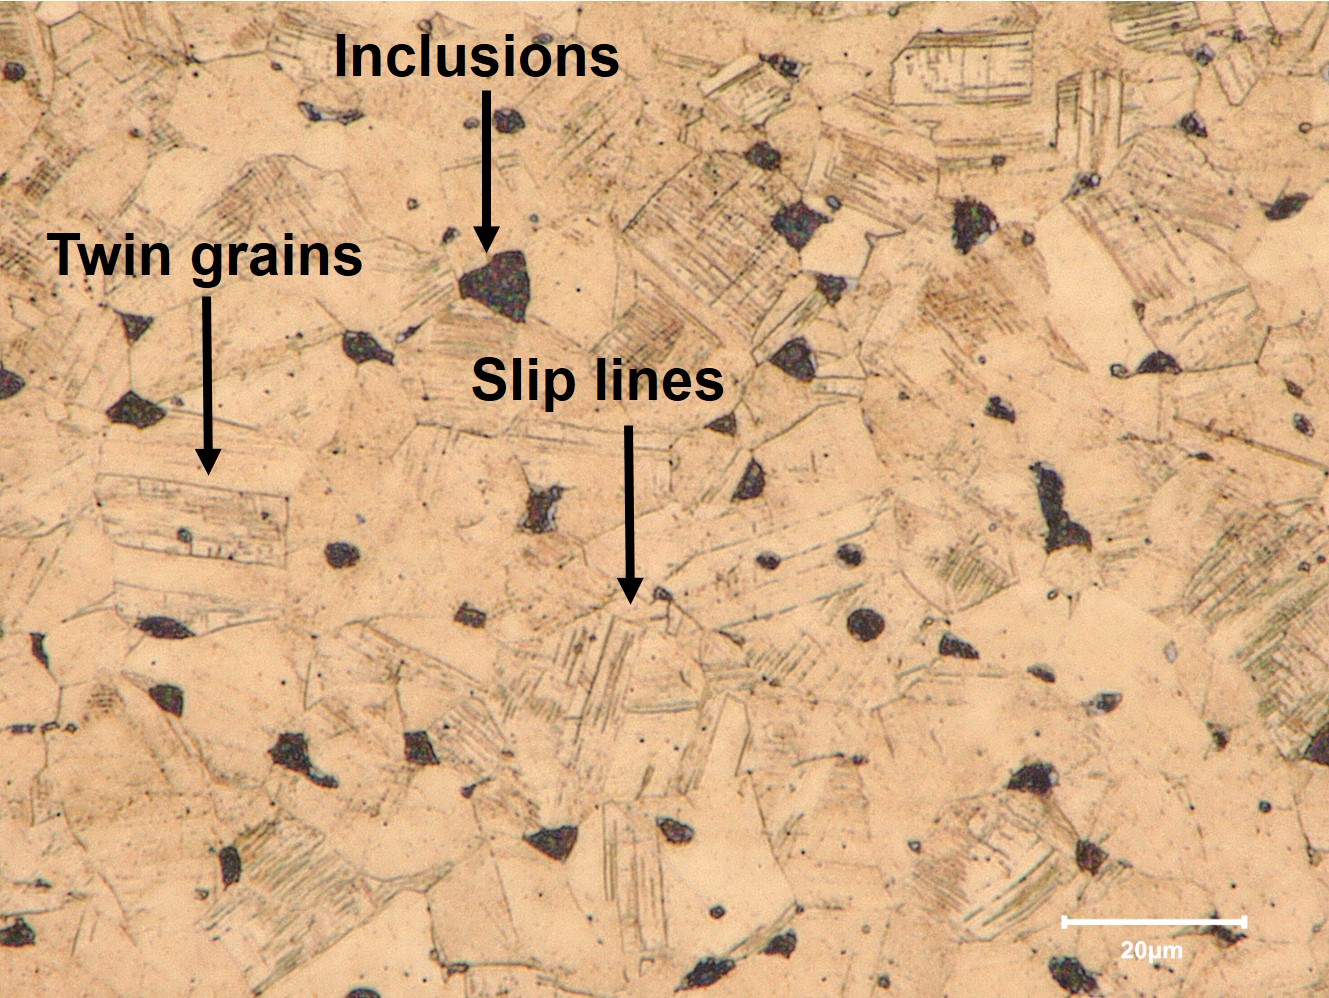
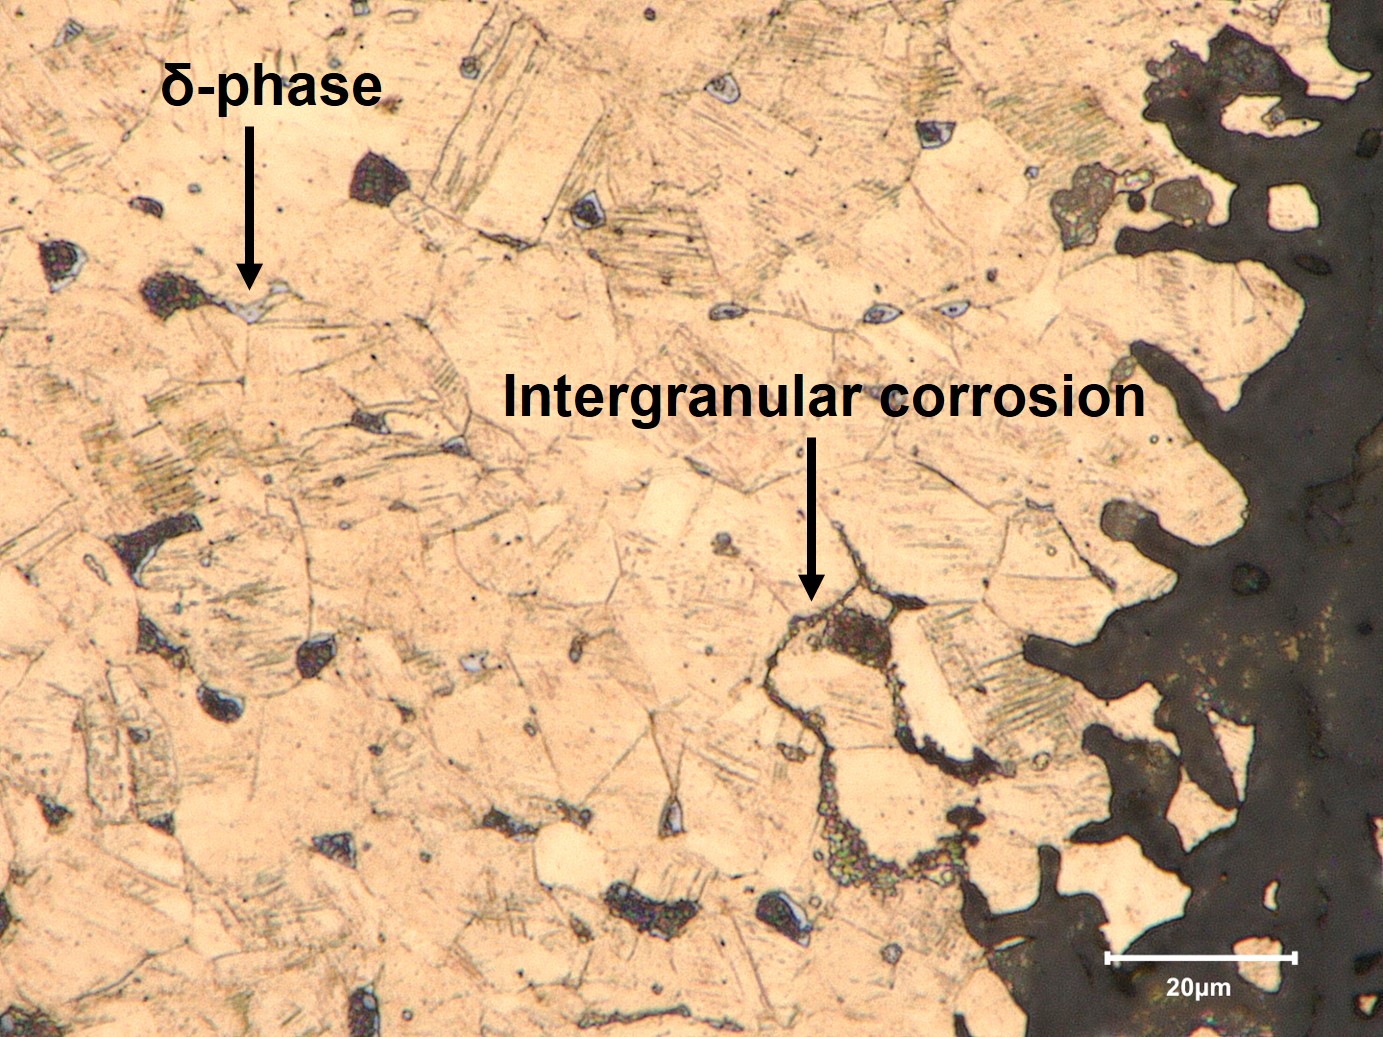
The metal has a grain structure (Fig. 7) with several twinned grains (Figs. 7 and 8), indicating that the object underwent an annealing procedure. On the whole sample, it is possible to observe the presence of slip lines (Figs. 7 and 8) caused by cold mechanical working of the metal after annealing. Numerous lead inclusions (Figs. 7 and 10) of dimension of around 10 μm are homogeneously distributed on the whole surface of the sample. Intergranular corrosion is observed (Figs. 6 and 8).
| Elements | mass % |
| Cu | 81 |
| Sn | 13.9 |
| Pb | 4.0 |
| As | <0.5 |
| Ni | <0.5 |
| Si |
<0.5 |
Table 3: Chemical composition of the alloy over a general area of analysis obtained by SEM-EDX.
 Credit LMC-CNRS, V.Valbi.
 Credit LMC-CNRS, V.Valbi.
 Credit LMC-CNRS, V.Valbi.
Polygonal grains with inclusions
Cu
Sn, Pb
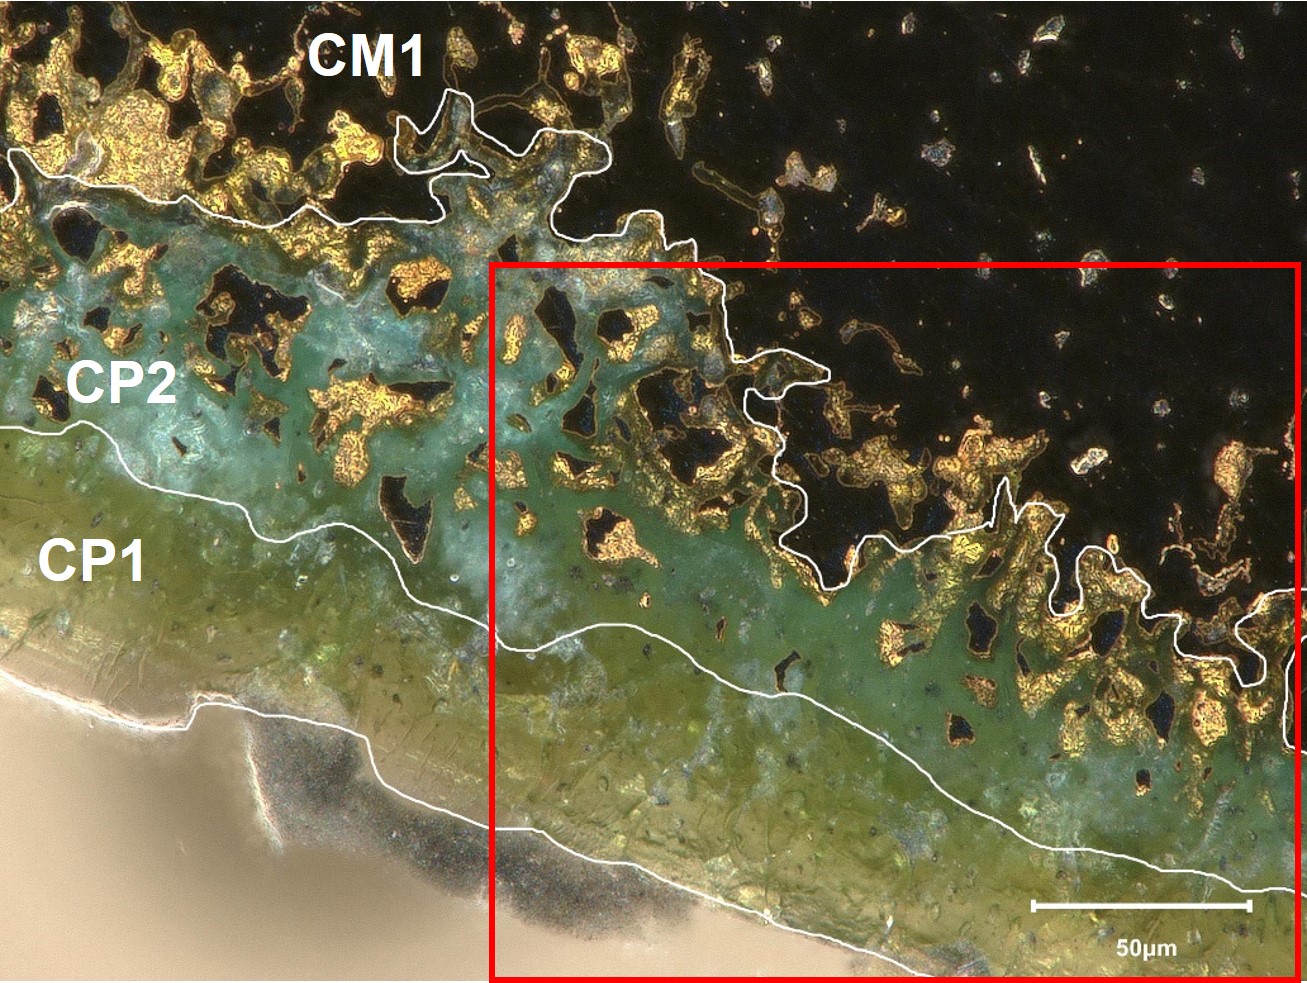
The interface roughness between the metal and the CPs, corresponding to the stratum identified as corroded metal (CM1), was measured through optical microscopy observation and the following parameters were determined (in µm): Rp=96, Rv = 25, Rt = 121, Ra = 35.
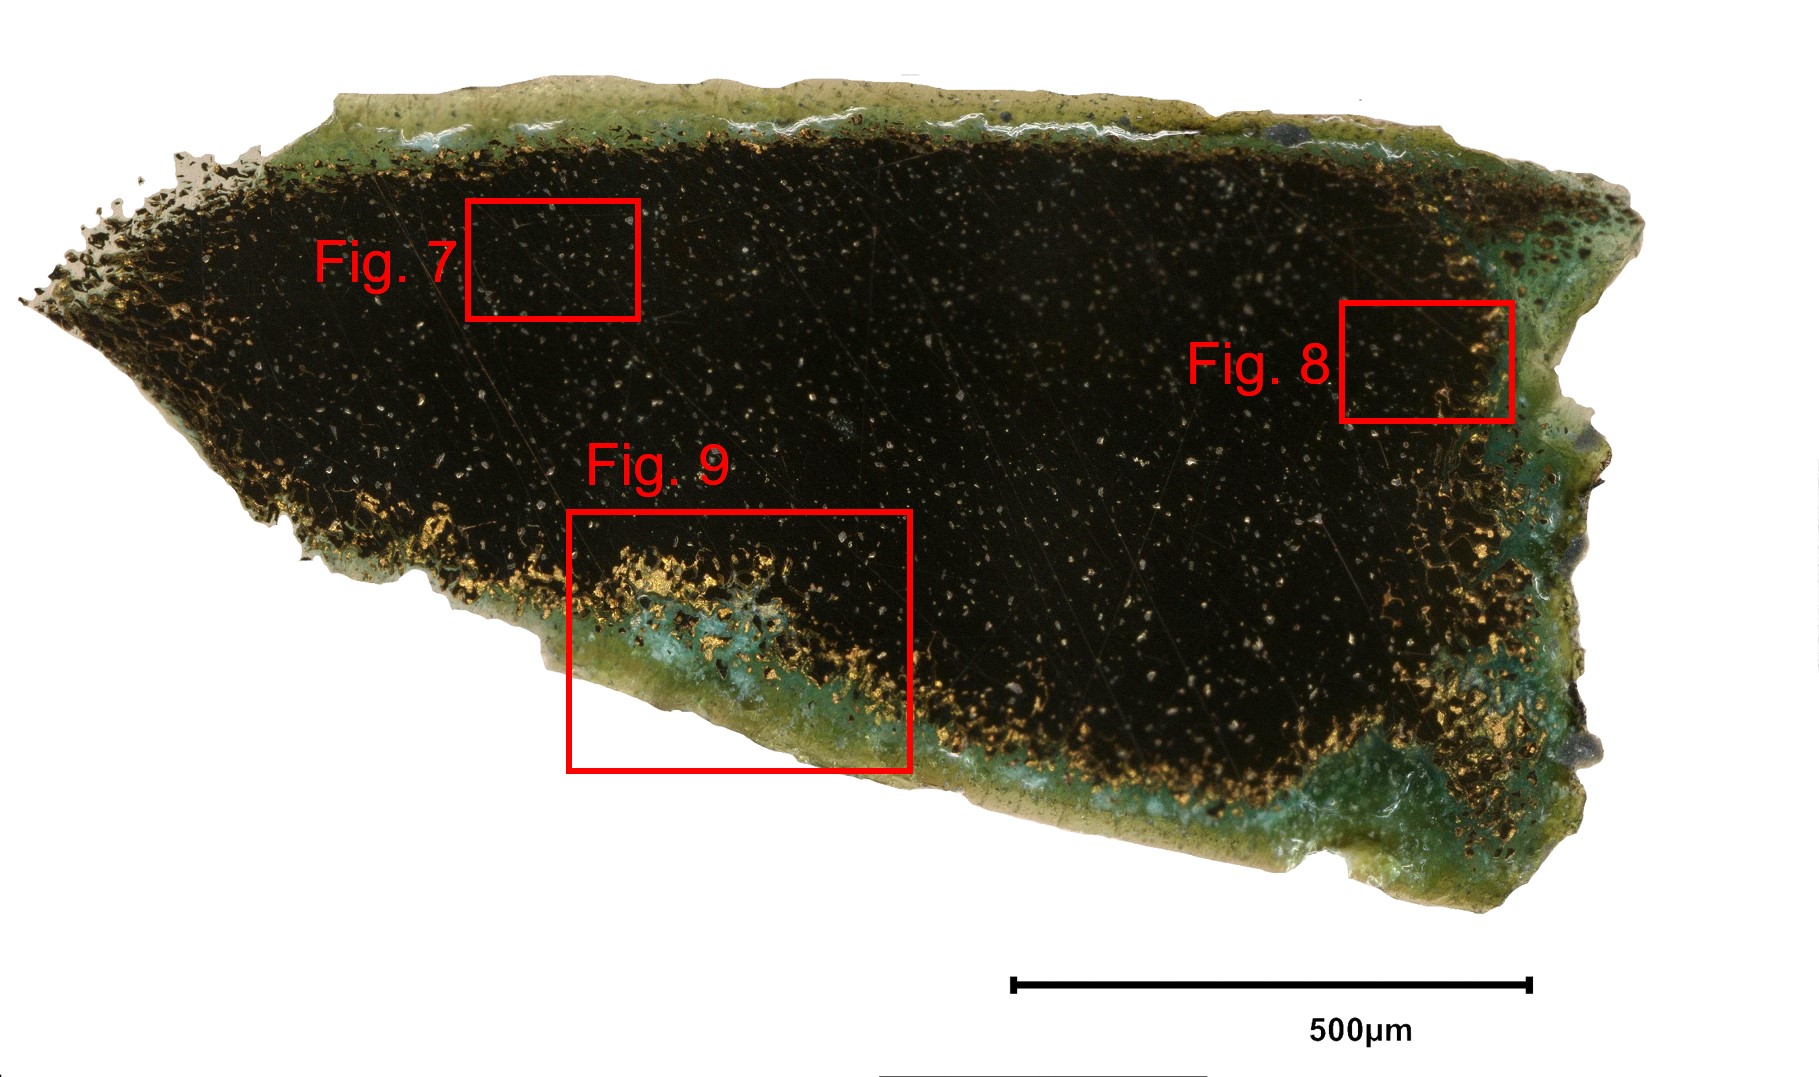
The observation of the sample in cross section in dark field (Figs. 5 and 9) allowed to identify an external continuous light green stratum (CP1), a dark green stratum (CP2) and a corroded metal stratum (CM1).
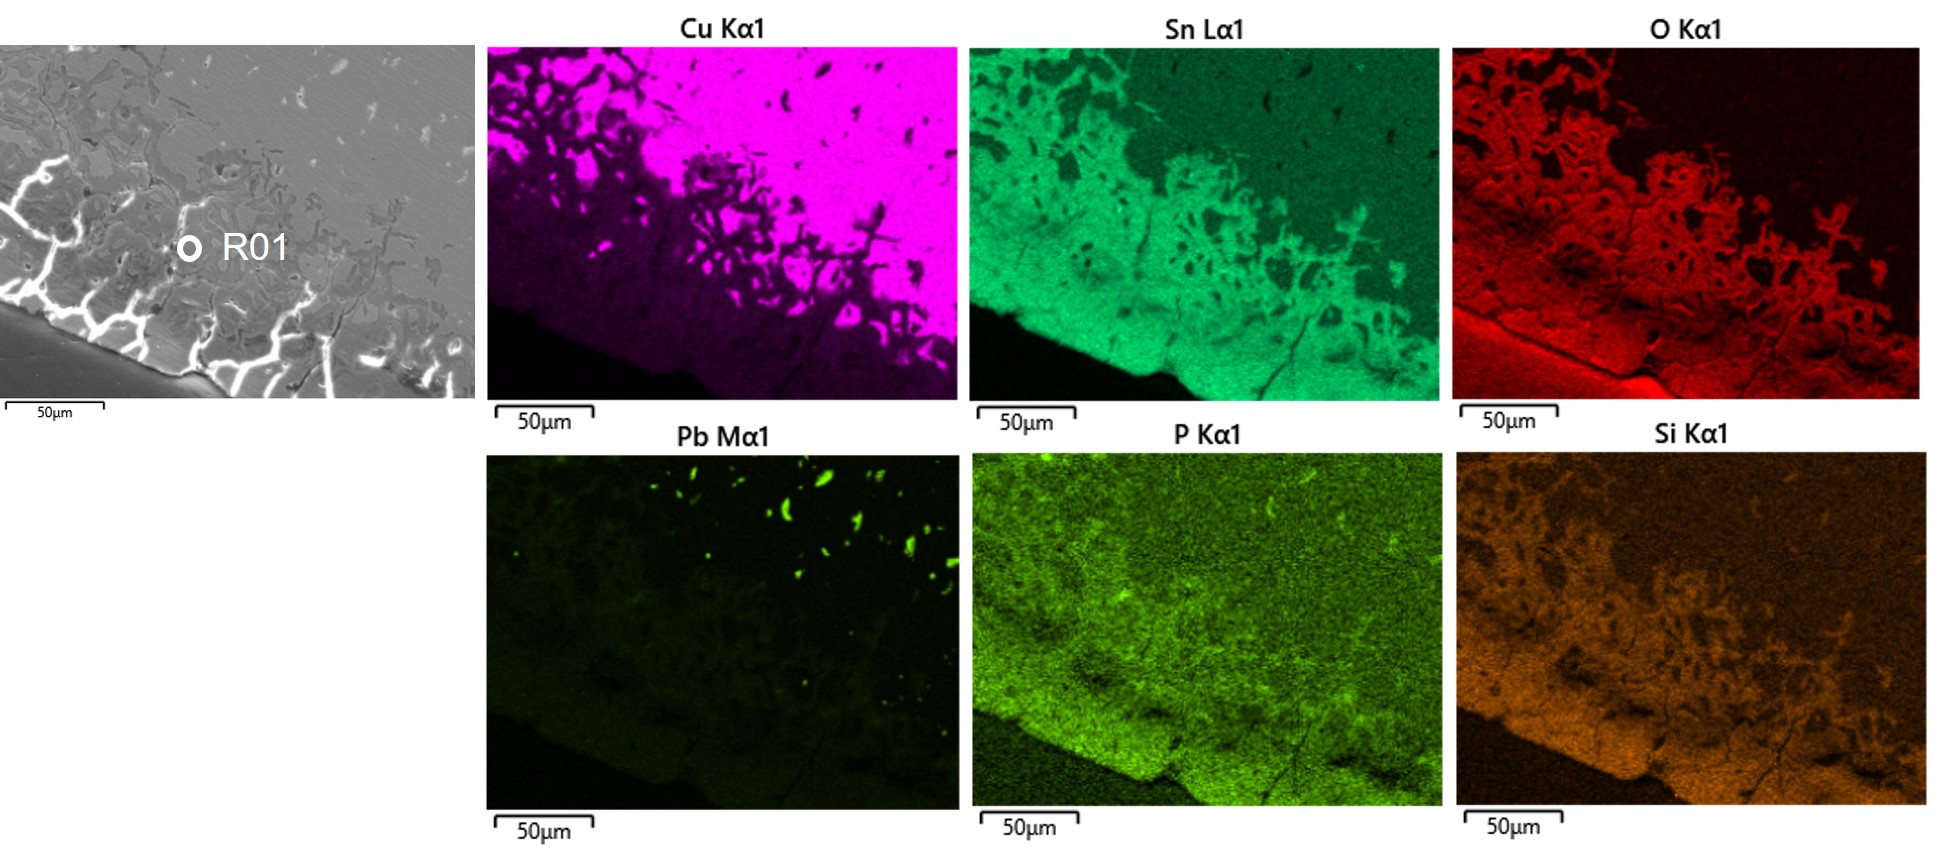
The EDX elemental analysis (Table 4) and mapping (Fig. 10) of the visually identified CPs by binocular and cross-sectional observations show that CP1 is Cu depleted, O and Sn enriched and polluted with Ca, Si and P from the soil, while CP2 is also Cu depleted and O and Sn rich but with less external polluting elements. These results are in agreement with the preliminary XRF analysis that already showed an enrichment in O and Sn and a depletion in Cu from the surface. No enrichment in Pb was though observed in cross-section.
| CP1 | CP2 | |
| Cu | 10.4 | 18.9 |
| Sn | 45.6 | 46.6 |
| O | 32.5 | 26.2 |
| Pb | 3.8 | 4.2 |
| Si | 3.5 | 2.6 |
| Ca | 2.0 | 1.0 |
| P | 1.0 | 0.6 |
| Cr | <0.5 | n.d. |
| Fe | <0.5 | n.d. |
| Ni | <0.5 | n.d. |
| Al | < 0.5 | n.d. |
Table 4: Chemical composition (mass%) of the corrosion layers over a general area of analysis in cross-section obtained by SEM-EDX.
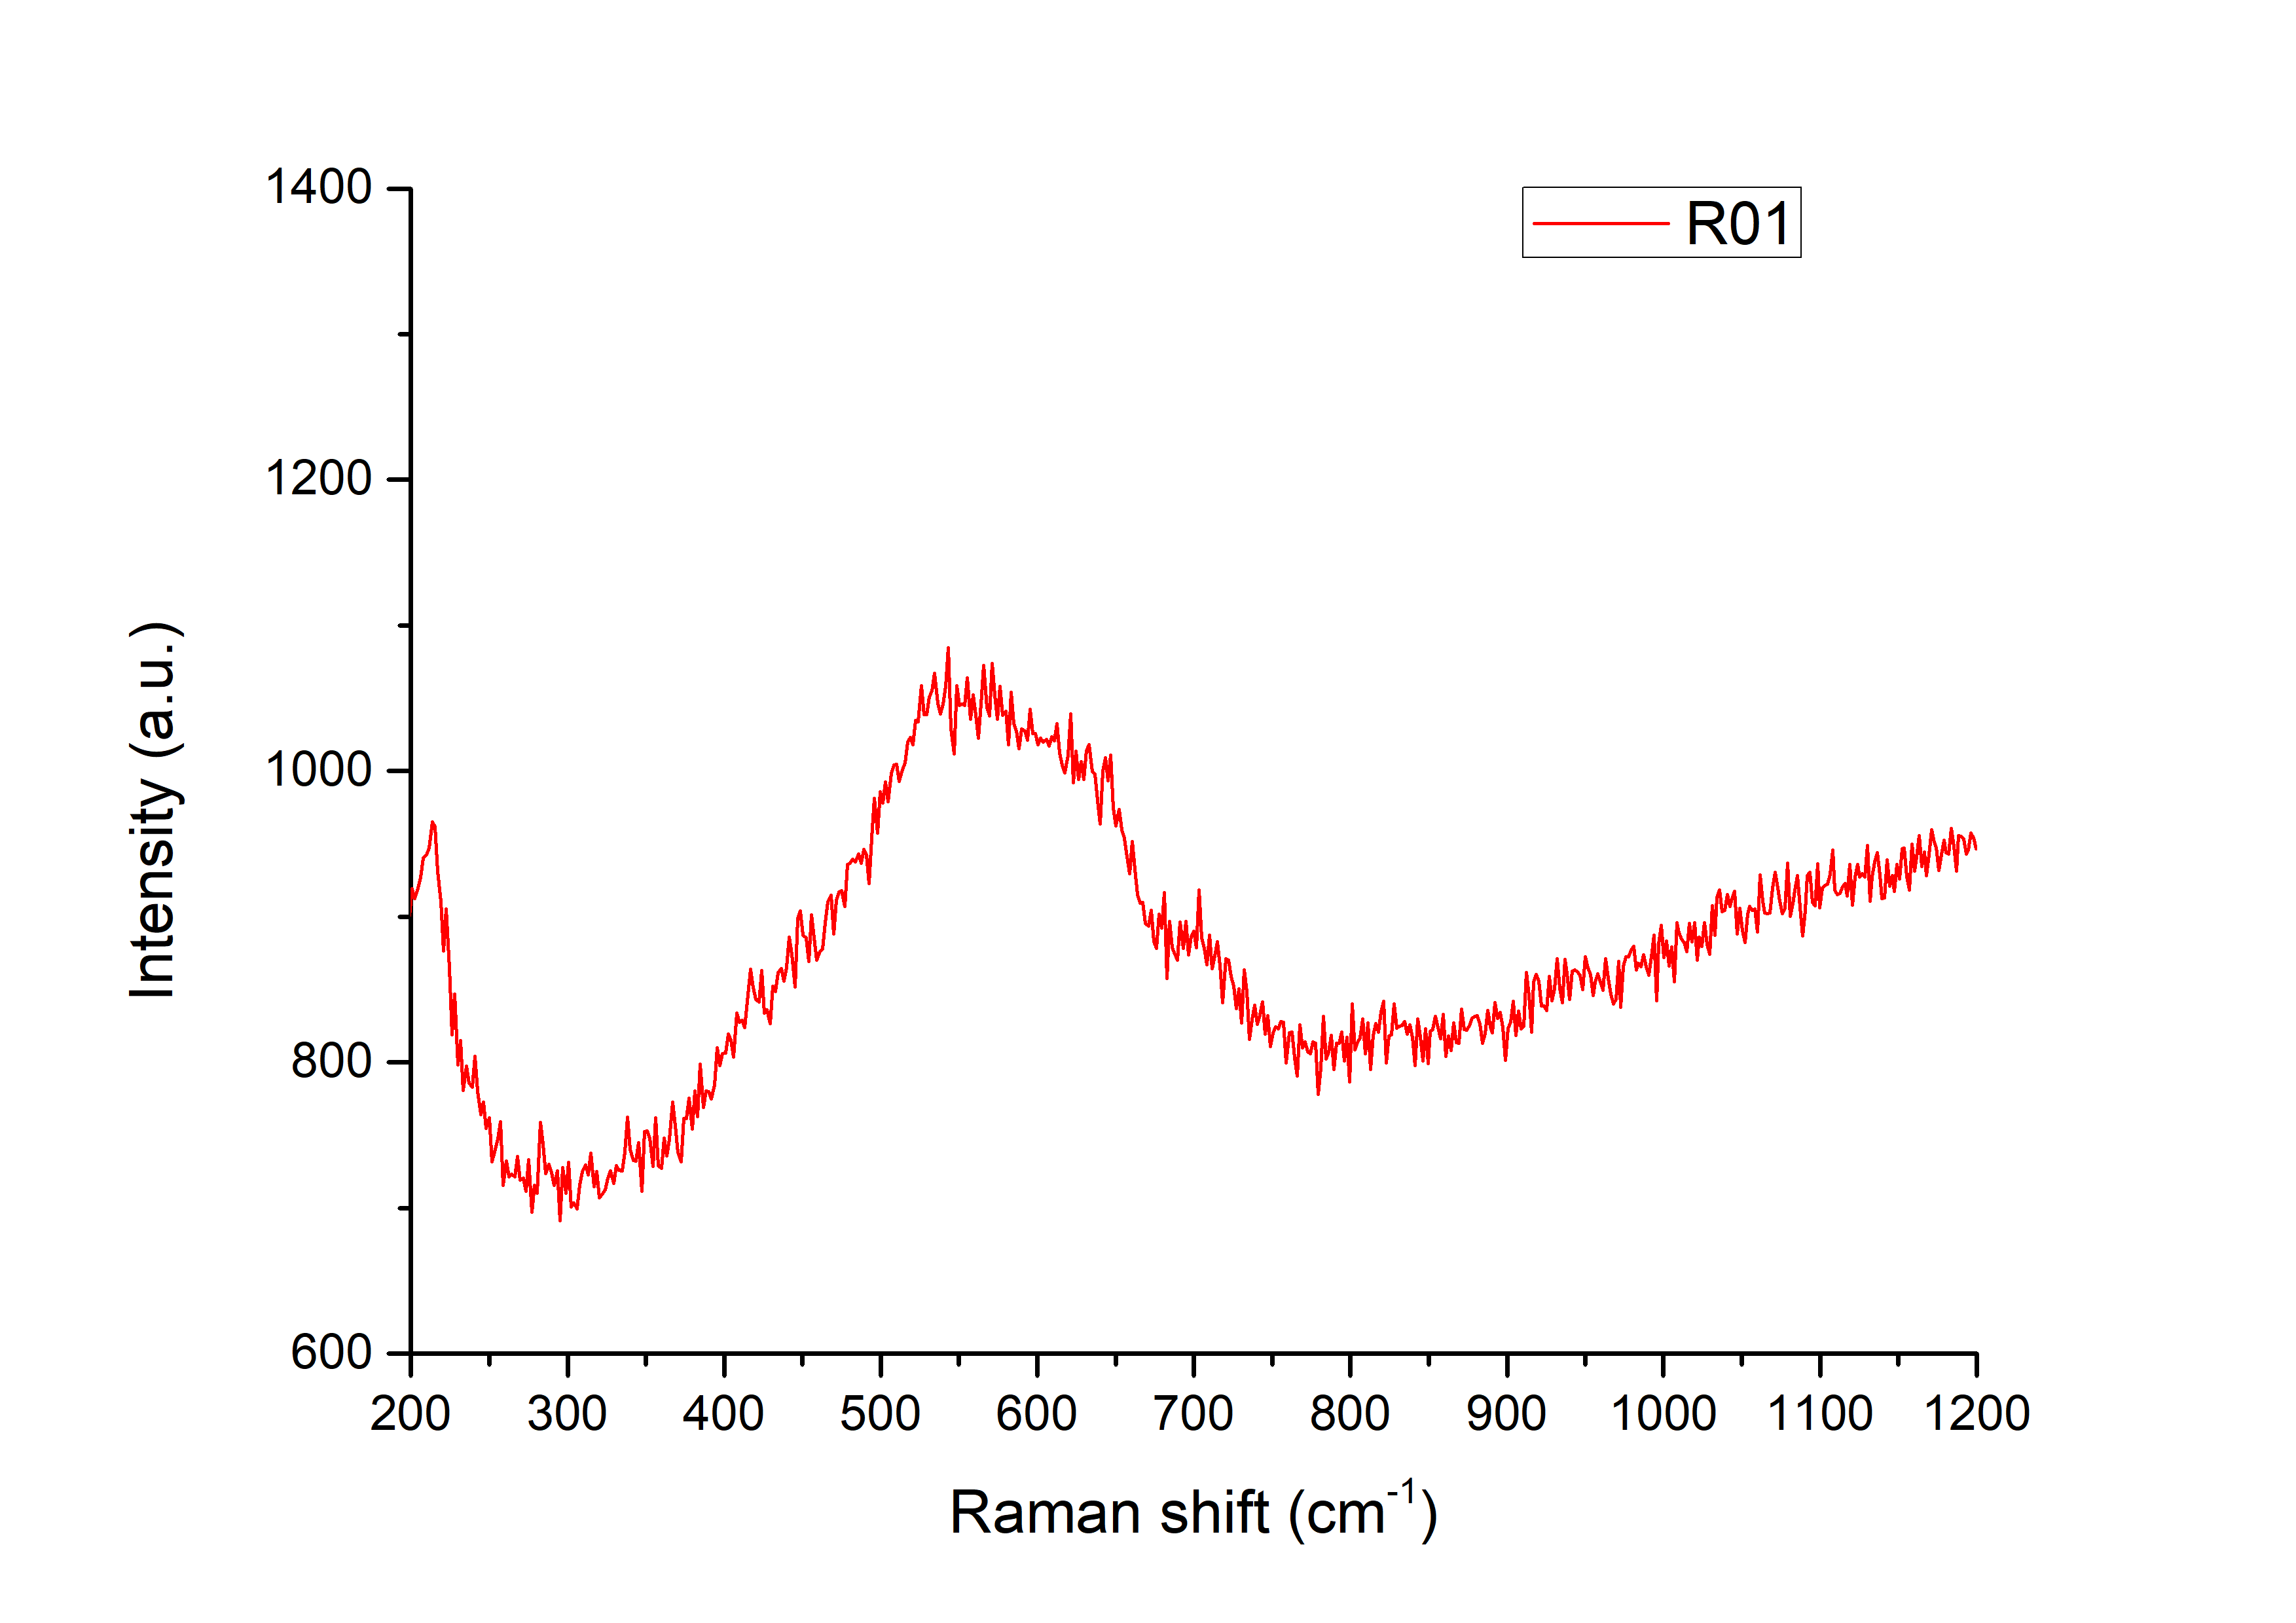
Analyses with µ-Raman were performed on the identified strata. The R01 (Fig. 11) point of analysis was performed on the green CP2 layer and the obtained spectrum has a broad peak at 560 cm-1 that can be attributed to nanocrystals of cassiterite Sn2O thanks to comparison with the work of Ospitali et al. 2012. The analysis point performed on the green external CP1 was too disturbed by fluorescence signal and an identification of the phase was impossible.
 Credit LMC-CNRS, V.Valbi.
 Credit LMC-CNRS, V.Valbi.
Uniform
Type I (Robbiola)
None.
One S and three CPs were identified by binocular observation, while two CPs and a CM were observed in cross-section.
The CP1 and CP2 observed in binocular observation correspond to the CP1 and CP2 observed in cross-section. The internal CP3 layer identified by binocular observation was not observed in cross-section. This could be explained by a discontinuous CP3 strata on the object.
The outer sediment layer (S1), easily identified under binocular, was not visible in the cross-section. On the contrary, the presence of a CM1 stratum was only revealed through cross-section observation. Moreover, information obtained under binocular examination such as brightness, compactness, cohesion, and adherence are not accessible during cross-sectional observation. Conversely, the physico-chemical characteristics obtained by cross-section examination are not easily accessible during the binocular examination. The differences observed underline the necessity and complementarity of these two approaches.
The bracelet is a tin bronze with Pb inclusions. The metallographic observation revealed that the metal was cold-worked, annealed, and has received final cold-working, in agreement with the surface decoration observed on the object.
The characterization of the corrosion products showed a typical corrosion structure for an archeological bronze. The object presents the phenomenon of decuprification with Sn enrichment. This is a common phenomenon observed on bronze archaeological objects buried in moderately aggressive natural conditions (such as oxygenated sandy soils). The enrichment in Ca, P and Si in the CP1 was also previously observed on archaeological objects (Robbiola et al. 1998, Papadopoulou et al. 2016) and can be attributed to the diffusion of these elements from the burial soil.
The good conservation condition of the original surface located, according to the Bertholon's method, at the interface of CP1 with S1 allows to identify the corrosion form as a Type I (according to Robbiola et al. 1998 classification). CP1 presents hammering traces and decoration which are typical markers of the original surface.
This bracelet is part of a corpus of four bracelets (bracelets bus-na 98 BZ 11 / bus-na 98 BZ 23 / bus-na 98 BZ 38 / bus-na 98 BZ 67) found on the same site. These artefacts are all drafts of bracelets but correspond to different stages of advancement: two bracelets are "as cast" and present no further working (bracelet bus-na 98 BZ 23 and bus-na 98 BZ 38) while two bracelets present signs of annealing and cold-working (bracelet bus-na 98 BZ 11 and bus-na 98 BZ 67).
References on object and sample
1. MiCorr_Bracelet bus-na 98 BZ 11
2. MiCorr_Bracelet bus-na 98 BZ 23
3. MiCorr_Bracelet bus-na 98 BZ 38
References on analytical methods and interpretation
4. Bertholon, R. (2001) Characterization and location of the original surface of corroded archaeological objects. Surface Engineering, 17 (3), 241-245.
5. Degrigny, C., Gaspoz, C., Rosselet, A., Boissonnas, V., Jeanneret, R. and Bertholon, R. (2016) The MIFAC-Metal Online project: developing a Decision Support System for locally invasive diagnosis of heritage metals, in METAL 2016, proceedings of the ICOM-CC Metal WG interim meeting, eds. R. Menon, C. Chemello and A. Pandya, New Dehli, (India), 220-227.
6. Lafuente, B., Downs, R. T., Yang, H., Stone, N. (2015) The power of databases: the RRUFF project. In: Highlights in Mineralogical Crystallography, T. Armbruster and R. M. Danisi, eds. Berlin, Germany, W. De Gruyter, 1-30.
7. Ospitali, F., Chiavari, C., Martini, C., Bernardi, E., Passarini, F., Robbiola, L. (2012) The characterization of Sn-based corrosion products in ancient bronzes: a Raman approach. Journal of Raman Spectrpscopy, 43 (11), 1596-1603.
8. Papadopoulou, O., Vassiliou, P., Grassini, S., Angelini, E. and Gouda, V. (2016) Soil-induced corrosion of ancient Roman brass – A case study. Materials and Corrosion, 67, No. 2.
9. Scott, D. (2006) Metallography and microstructure of ancient and historic metals. J Paul Getty Museum Publications.
10. Robbiola L., Blengino M., Fiaud C., (1998) Morphology and mechanisms of formation of natural patinas on archaeological Cu–Sn alloys. Corrosion Science, 40 (12), 2083-2111.