Axe D.2019.4.2.1
Christian. Degrigny (HE-Arc CR, Neuchâtel, Neuchâtel, Switzerland) & Naima. Gutknecht (HE-Arc CR, Neuchâtel, Neuchâtel, Switzerland) & Valentina. Valbi (Laboratoire Métallurgie et Culture (LMC), Belfort, Franche-Comté, France)
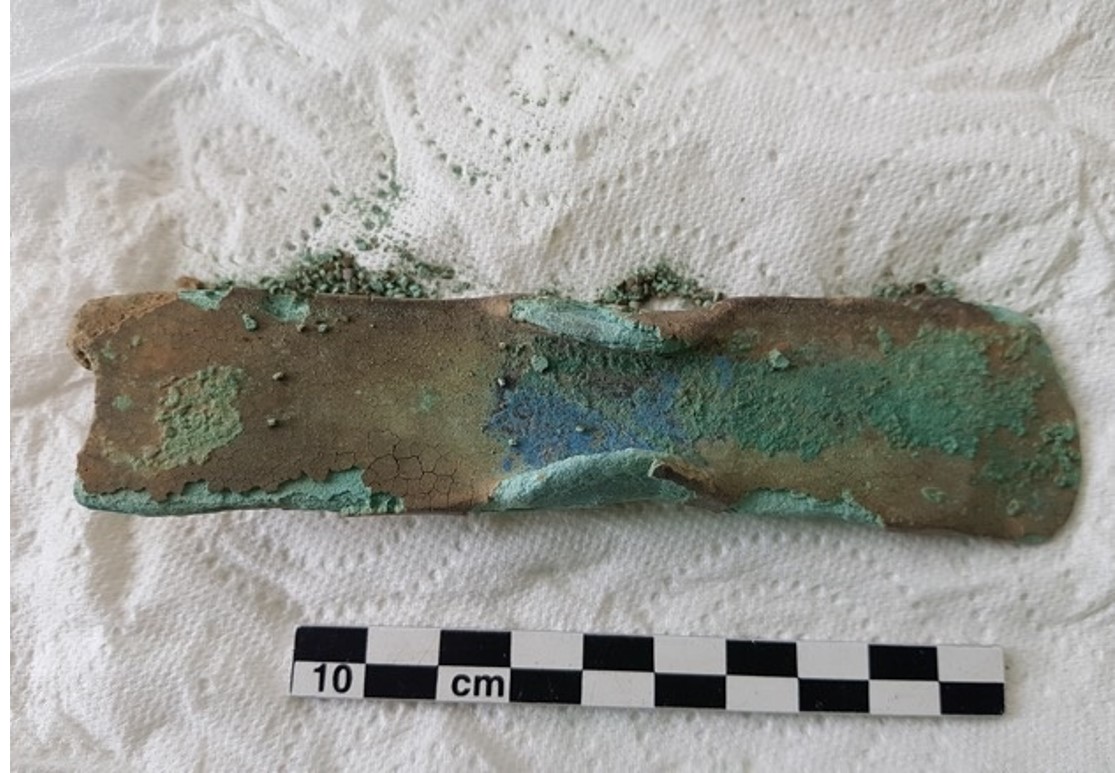
Elongated axe with median wings and curvature in the center. It is covered with a brown crust and blue-green corrosion products that show areas of flaking. Dimensions: L = 14.3cm; W = 3.1cm.
Tool
Granges Feuillet, dépôt n°2, Salins-les-Bains, Franche-Comté, France
2012
Late Bronze Age
Soil
Musée de Lons-le-Saunier, Lons-le-Saunier, Franche-Comté
Musée de Lons-le-Saunier (dépôt de Salins-les-Bains)
D.2019.4.2.1
N/a
From the time of excavation in 2012 until its entry into the museum in 2015, the object was kept in a food storage box in an uncontrolled environment. Flaking corrosion was documented when the object was collected and stored by the museum in 2015.
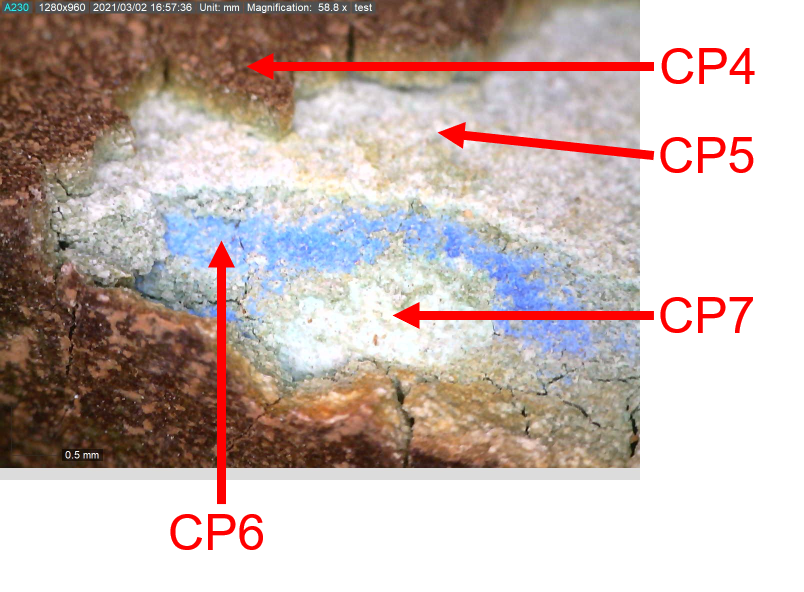
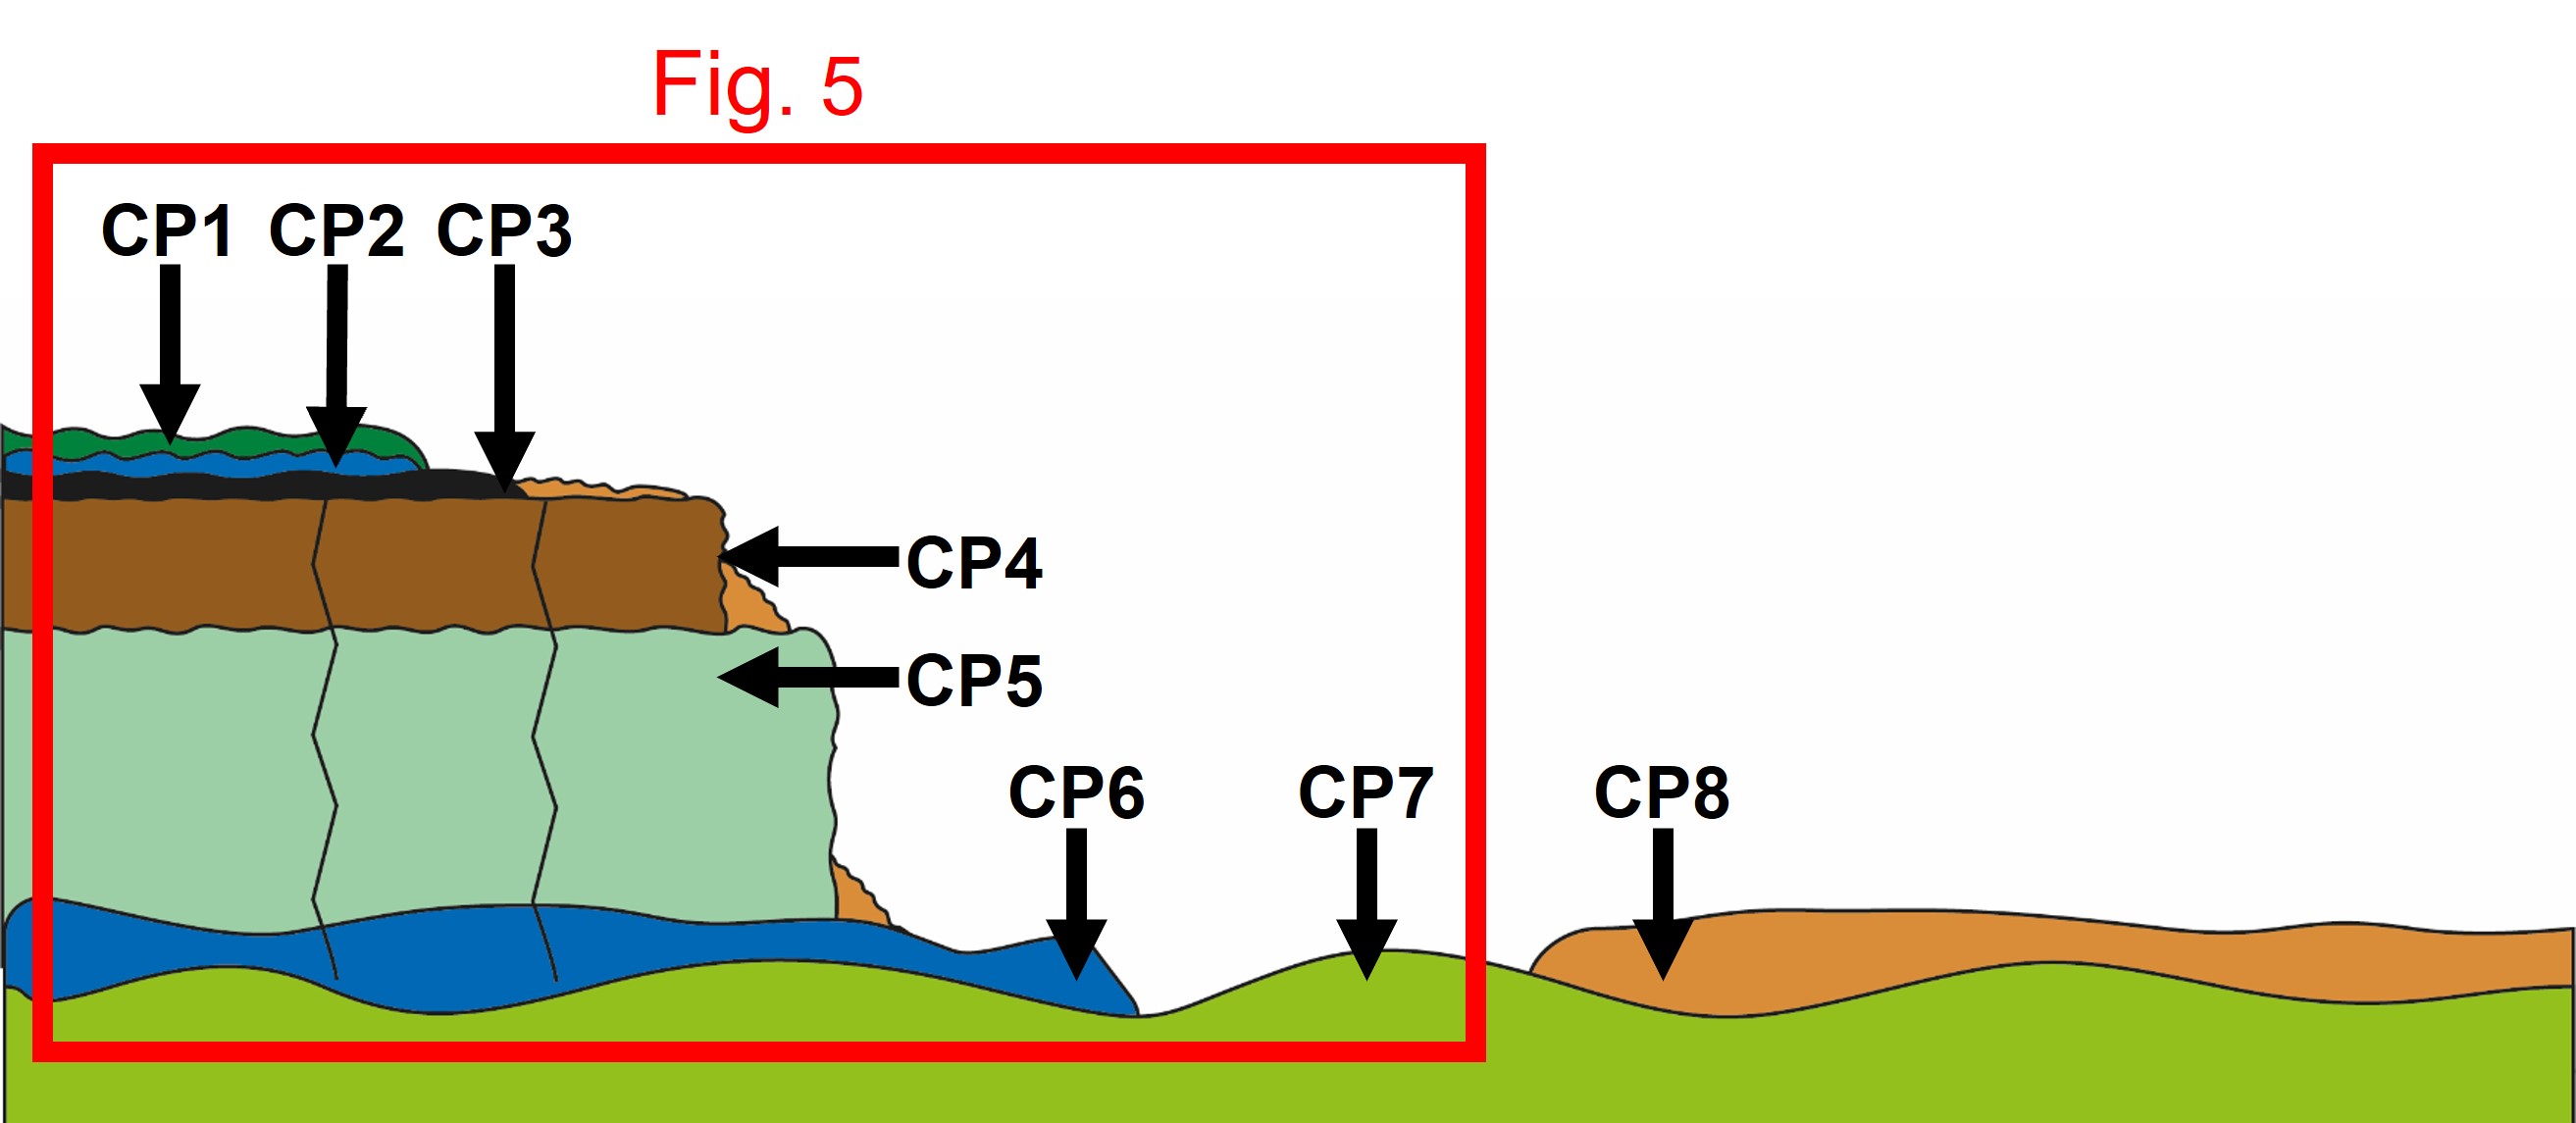
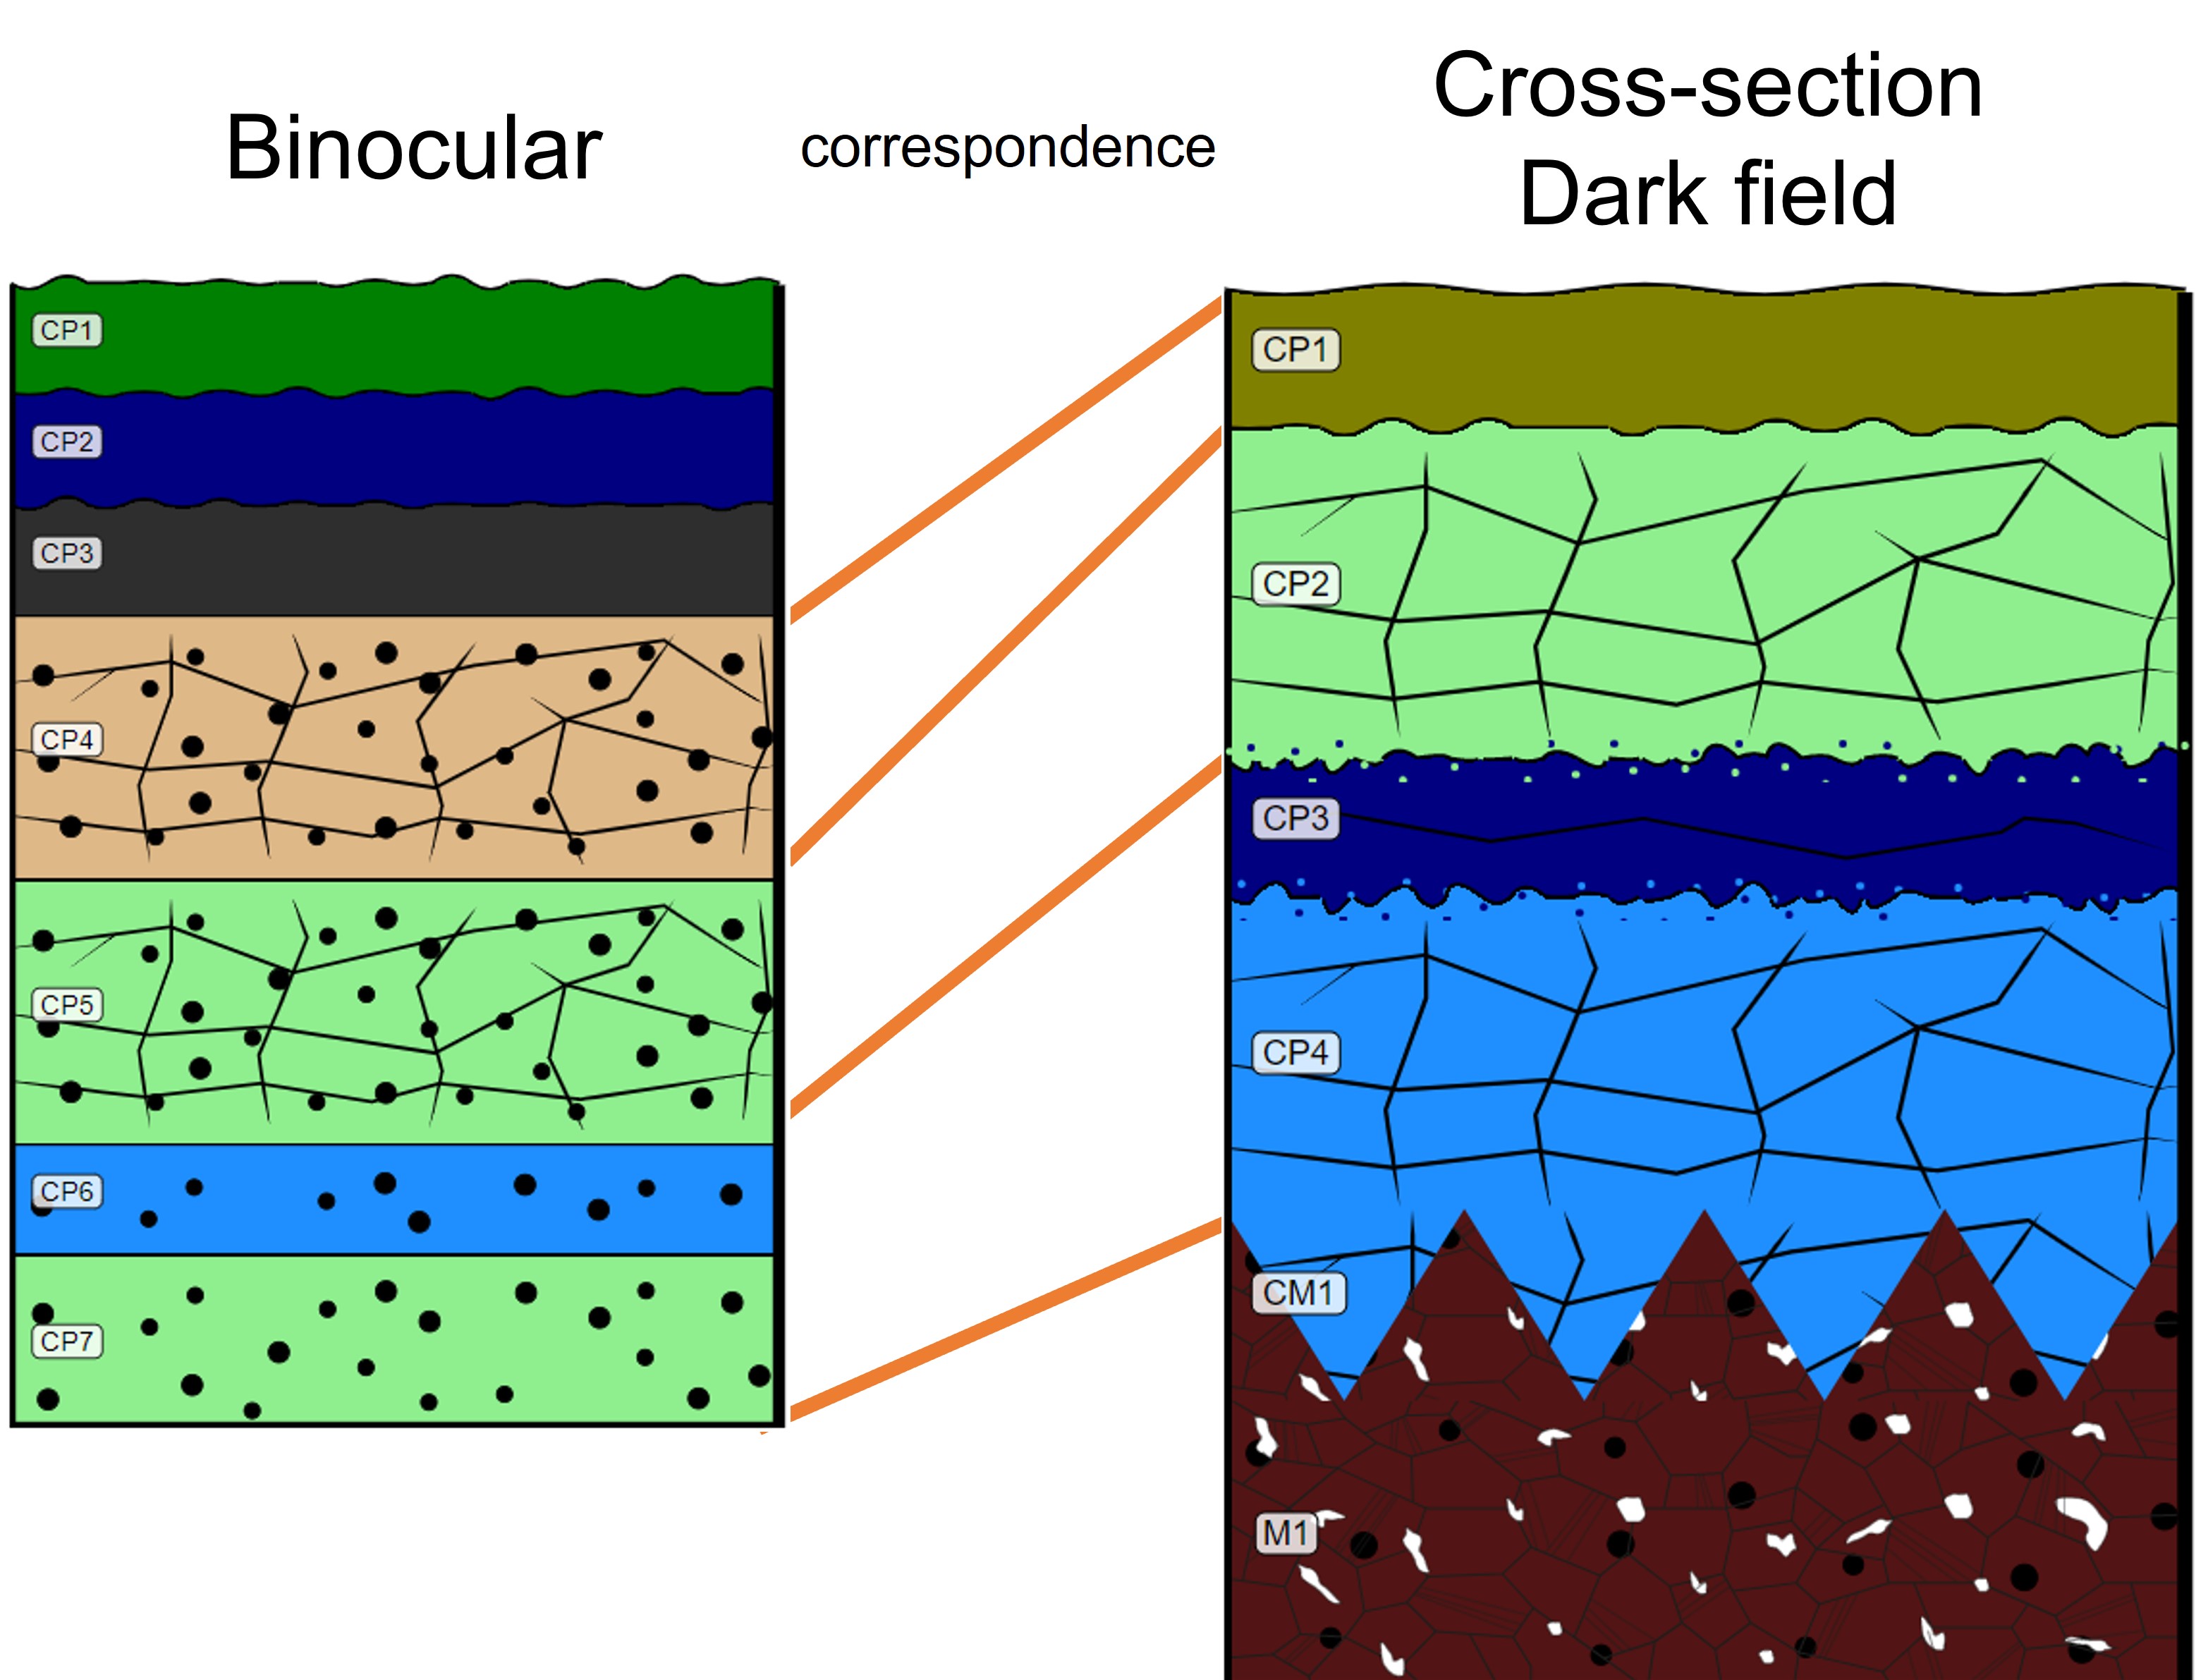
The schematic representation below gives an overview of the corrosion structure encountered on the axe from a first visual macroscopic observation.
| Strata | Type of stratum | Principal characteristics |
| CP1 | Corrosion product | green, thin, isolated, non-compact, soft |
| CP2 | Corrosion product | blue, thin, isolated, compact, soft |
| CP3 | Corrosion product | black, thin, isolated, compact, soft |
| CP4 | Corrosion product | light brown, thick, discontinuous, non-compact, soft |
| CP5 | Corrosion product | light green, thick, discontinuous, non-compact, soft |
| CP6 | Corrosion product | blue, thin, discontinuous, non-compact, very soft |
| CP7 | Corrosion product | light green, medium, continuous, non-compact, soft |
| CP8 | Corrosion product | orange, thin, isolated, non-compact, soft |
Table 1: Description of the principal characteristics of the strata as observed under binocular and described according to Bertholon's method.
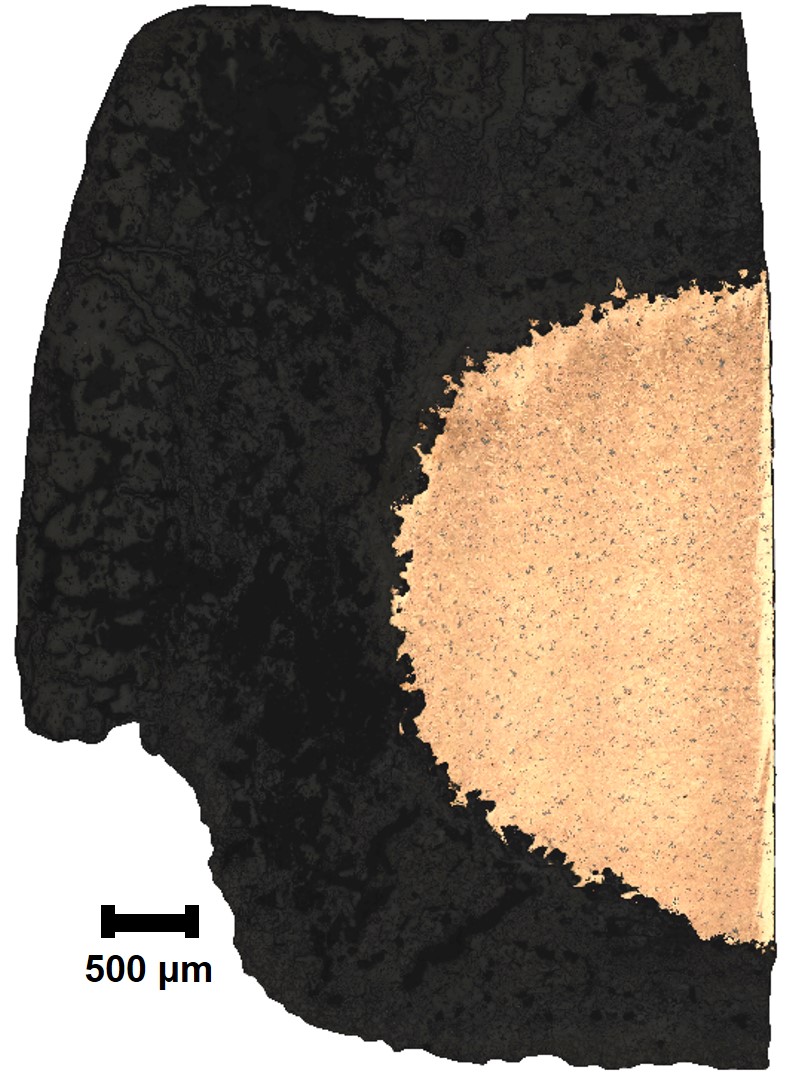
The cross-section corresponds to a lateral cut (Fig. 2) and is representative of the entire thickness of the axe's body. A metallic core is present below the corrosion layers (Fig. 6).
Cu Alloy
Annealed after cold working
Centre de Conservation et d’Etude René-Rémond, Lons-le-Saunier
Centre de Conservation et d’Etude René-Rémond, Lons-le-Saunier
April 2021
Since the object is suffering from a flaking phenomenon of the corrosion products, a special methodology was developed in order to sample the object without loss of information. As a first step, a few drops of resin were used to "consolidate" the corrosion products and avoid their loss during the sampling. A few days later when the resin was hard, the sampling was realized with a rotatory tool and embodied in a similar resin for cross-section documentation.
Analyses performed
Invasive approach (on the sample)
- Optical microscopy: the sample is polished, then it is observed with a numerical microscope KEYENCE VHX-7000 in bright and dark field.
- Metallography: the polished sample is etched with alcoholic ferric chloride and observed by optical microscopy in bright field.
- SEM-EDX: the sample is coated with a carbon layer and analyses are performed on a SEM-FEG JEOL 7001-F equipped with a silicon-drift EDX Oxford detector (Aztec analysis software) with an accelerating voltage of 20 kV and probe current at about 9 nA. The relative error is considered of about 10% for content range <1wt%, and of 2% for content range of >1wt%.
- µ-Raman spectroscopy: it is performed on a HORIBA Labram Xplora spectrometer equipped with a 532 nm laser with 1800 grating, the laser power employed is between 0.04 and 0.55 mW with acquisition time varying between 1 and 5 minutes.
- µ-X-ray Diffraction: measurements were realized using an X-Ray generator (RU-200B) in reflection mode with data collected from an angle of 5° (2θ) delivering a monochromatic beam of 600 x 30 µm at 17.5 keV (Mo, Ka1,2). Diffraction patterns were collected using a 2D detector (Pilatus 300K - Dectris). Data process was realised with PyFAI and EVA softwares using the ICDD-JCPDS database.
None.
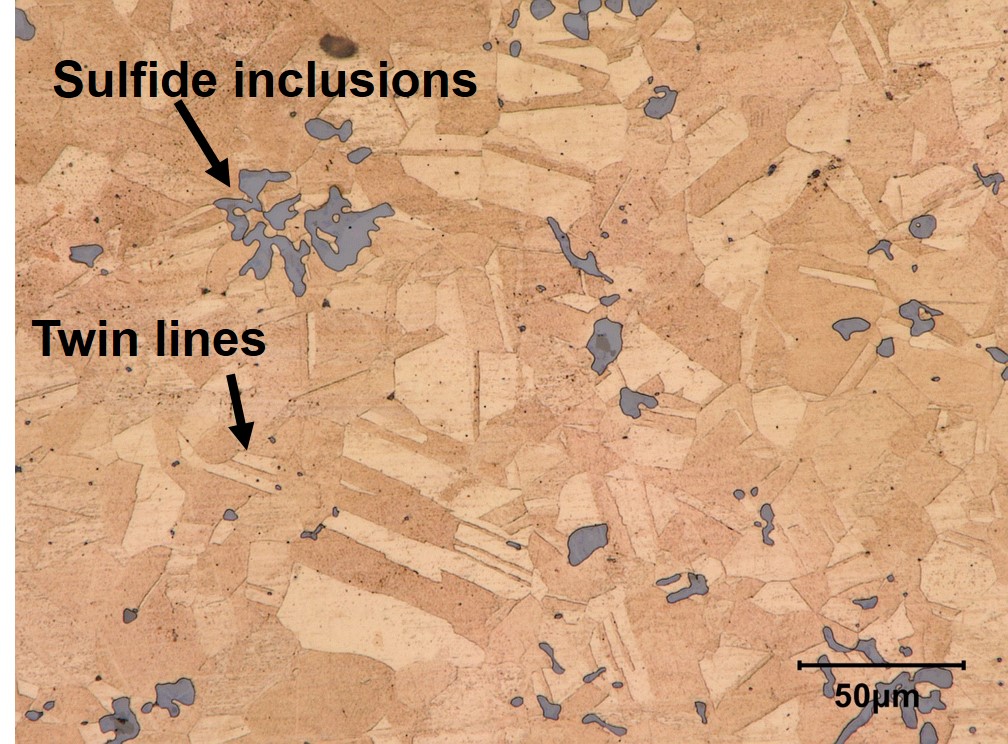
EDX analysis (Table 2) of the residual metal analyzed on cross-section indicates that it is a low tin bronze with 8 wt% of Sn and 1 wt% of S. The metal has a polygonal grains microstructure (Figs. 7 & 8) with several twinned grains (Fig. 8) revealing that the object underwent an annealing procedure. Sulfide Cu-S-Fe inclusions (10-50 μm, Fig. 8) and Pb inclusions (1-3 μm) are homogeneously distributed on the whole sample.
|
wt% |
Metal (general aera) |
Sulfide inclusions |
|
Cu |
90 |
81 |
|
Sn |
8 |
0 |
|
S |
1 |
18 |
|
Pb |
<0.5 |
0 |
|
Fe |
<0.5 |
1 |
|
Ni |
<0.5 |
0 |
|
As |
<0.5 |
0 |
|
Total |
100 |
0 |
Table 2: Chemical composition of the alloy over a general area of analysis and of the sulfide inclusions by SEM-EDX, LMC-IRAMAT-CNRS-UTBM.
 Credit LMC-CNRS, V. Valbi.
Polygonal and twinned grains
Cu
S, Sn
None.
The observation of the sample in dark field mode shows the presence of a thick (1500-2000 µm) and porous/fractured corrosion structure. The corrosion structure can be subdivided into: a thin external olive green CP1, a light green thick CP2, a blue discontinuous CP3, a light blue CP4 with red and black inclusions, CM1 and M1 (Fig. 9).
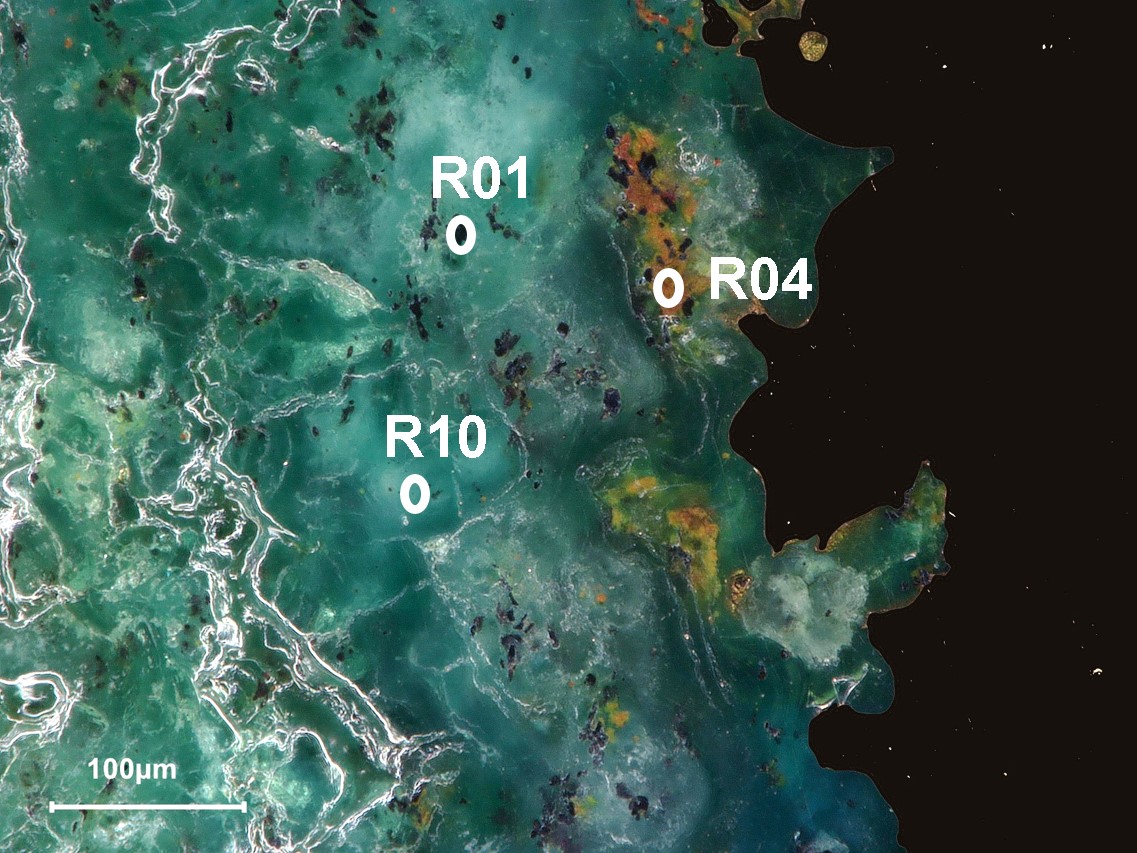
The EDX elemental analysis (Table 3) reveals a Sn-enrichment in the whole corrosion structure (27-54 wt%) when compared to the original amount of this element in the alloy (8 wt%). The strongest Sn-enrichment is observed for CP1 and CP2, with 52-54 Sn wt%, low amounts of Cu (9-10 wt%), and a few percents of external elements such as Si and Al (1-2 wt%). CP3 is richer in Cu (around 40 Cu wt% and 27 Sn wt%), while the CP4 is richer in Sn than Cu (36 Sn wt% and 28 Cu wt%). It was also possible to analyze the black spots inside the CP4, which are composed mainly of Cu (55 wt%) and S (around 30 wt%) with 11 wt% of Ag.
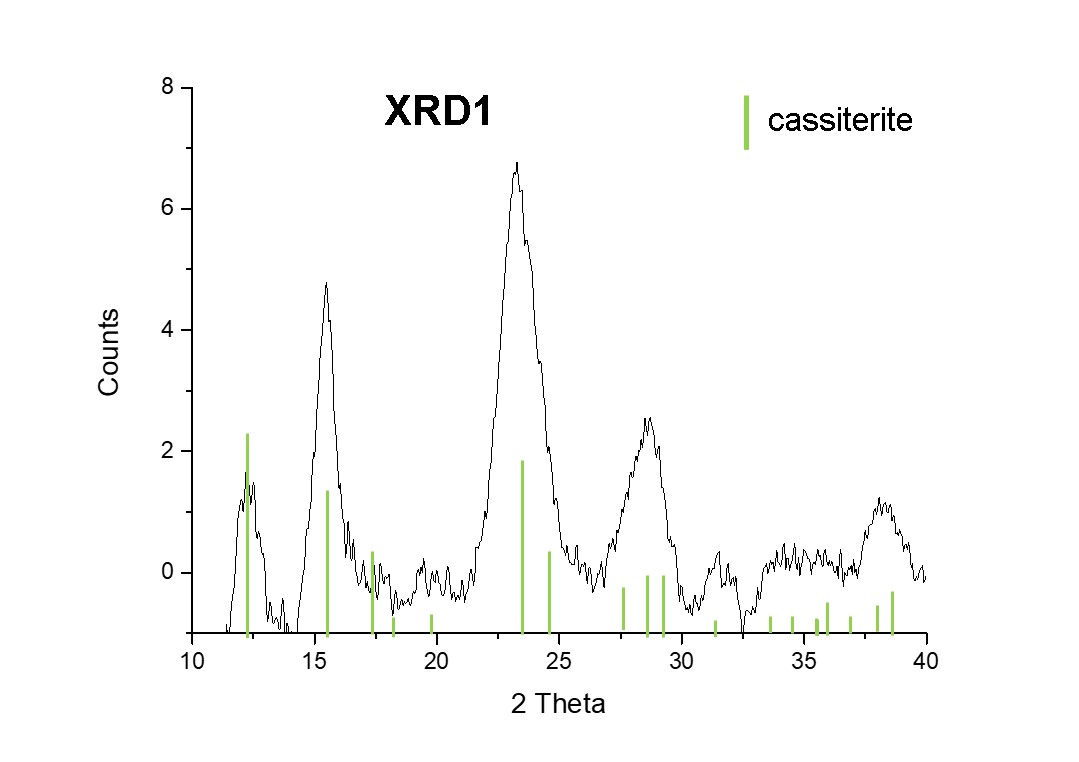
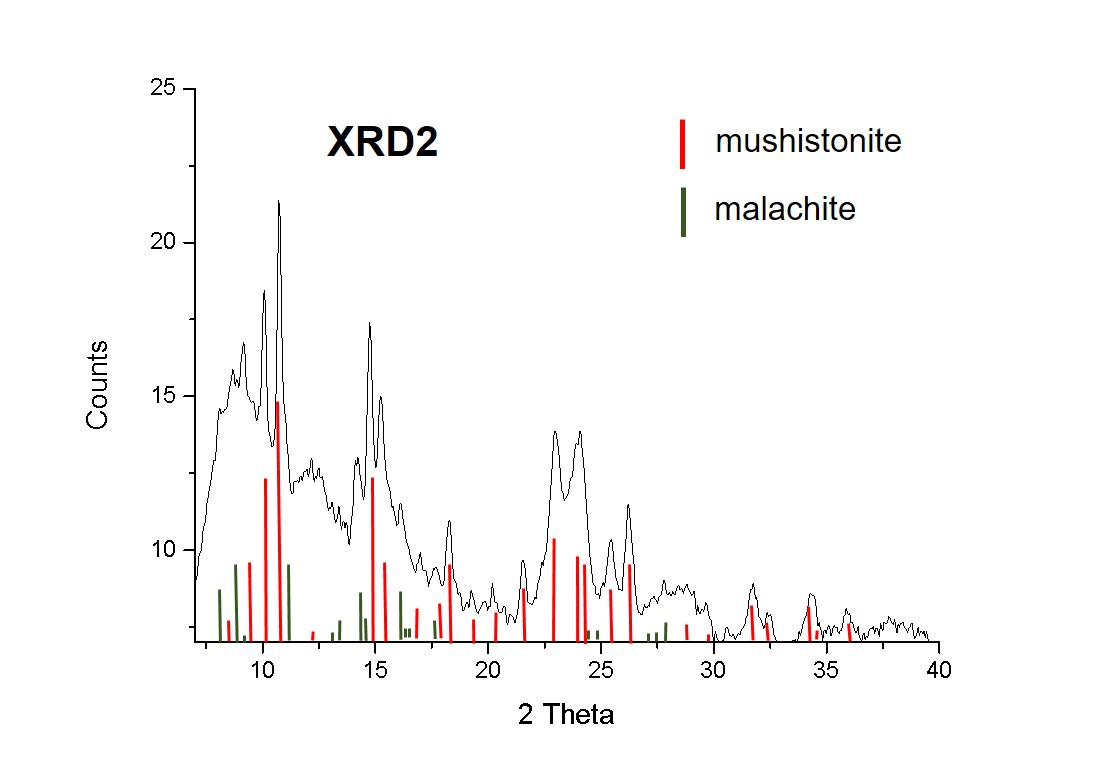
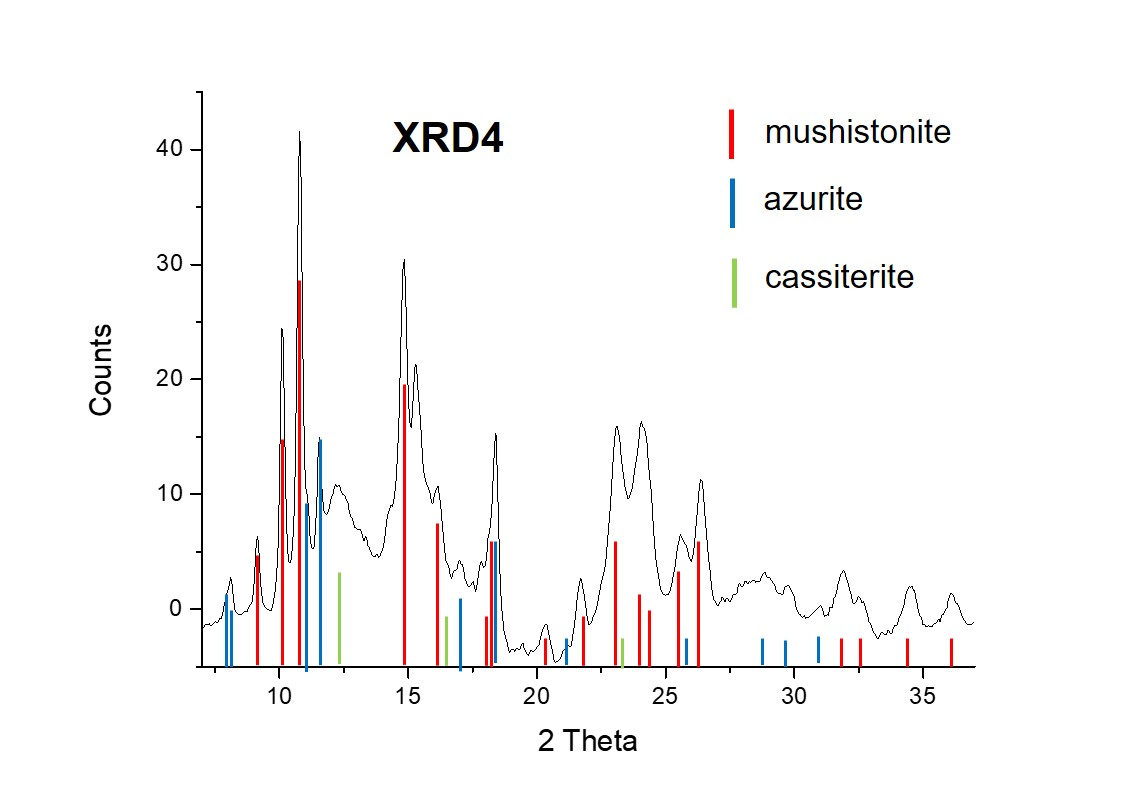
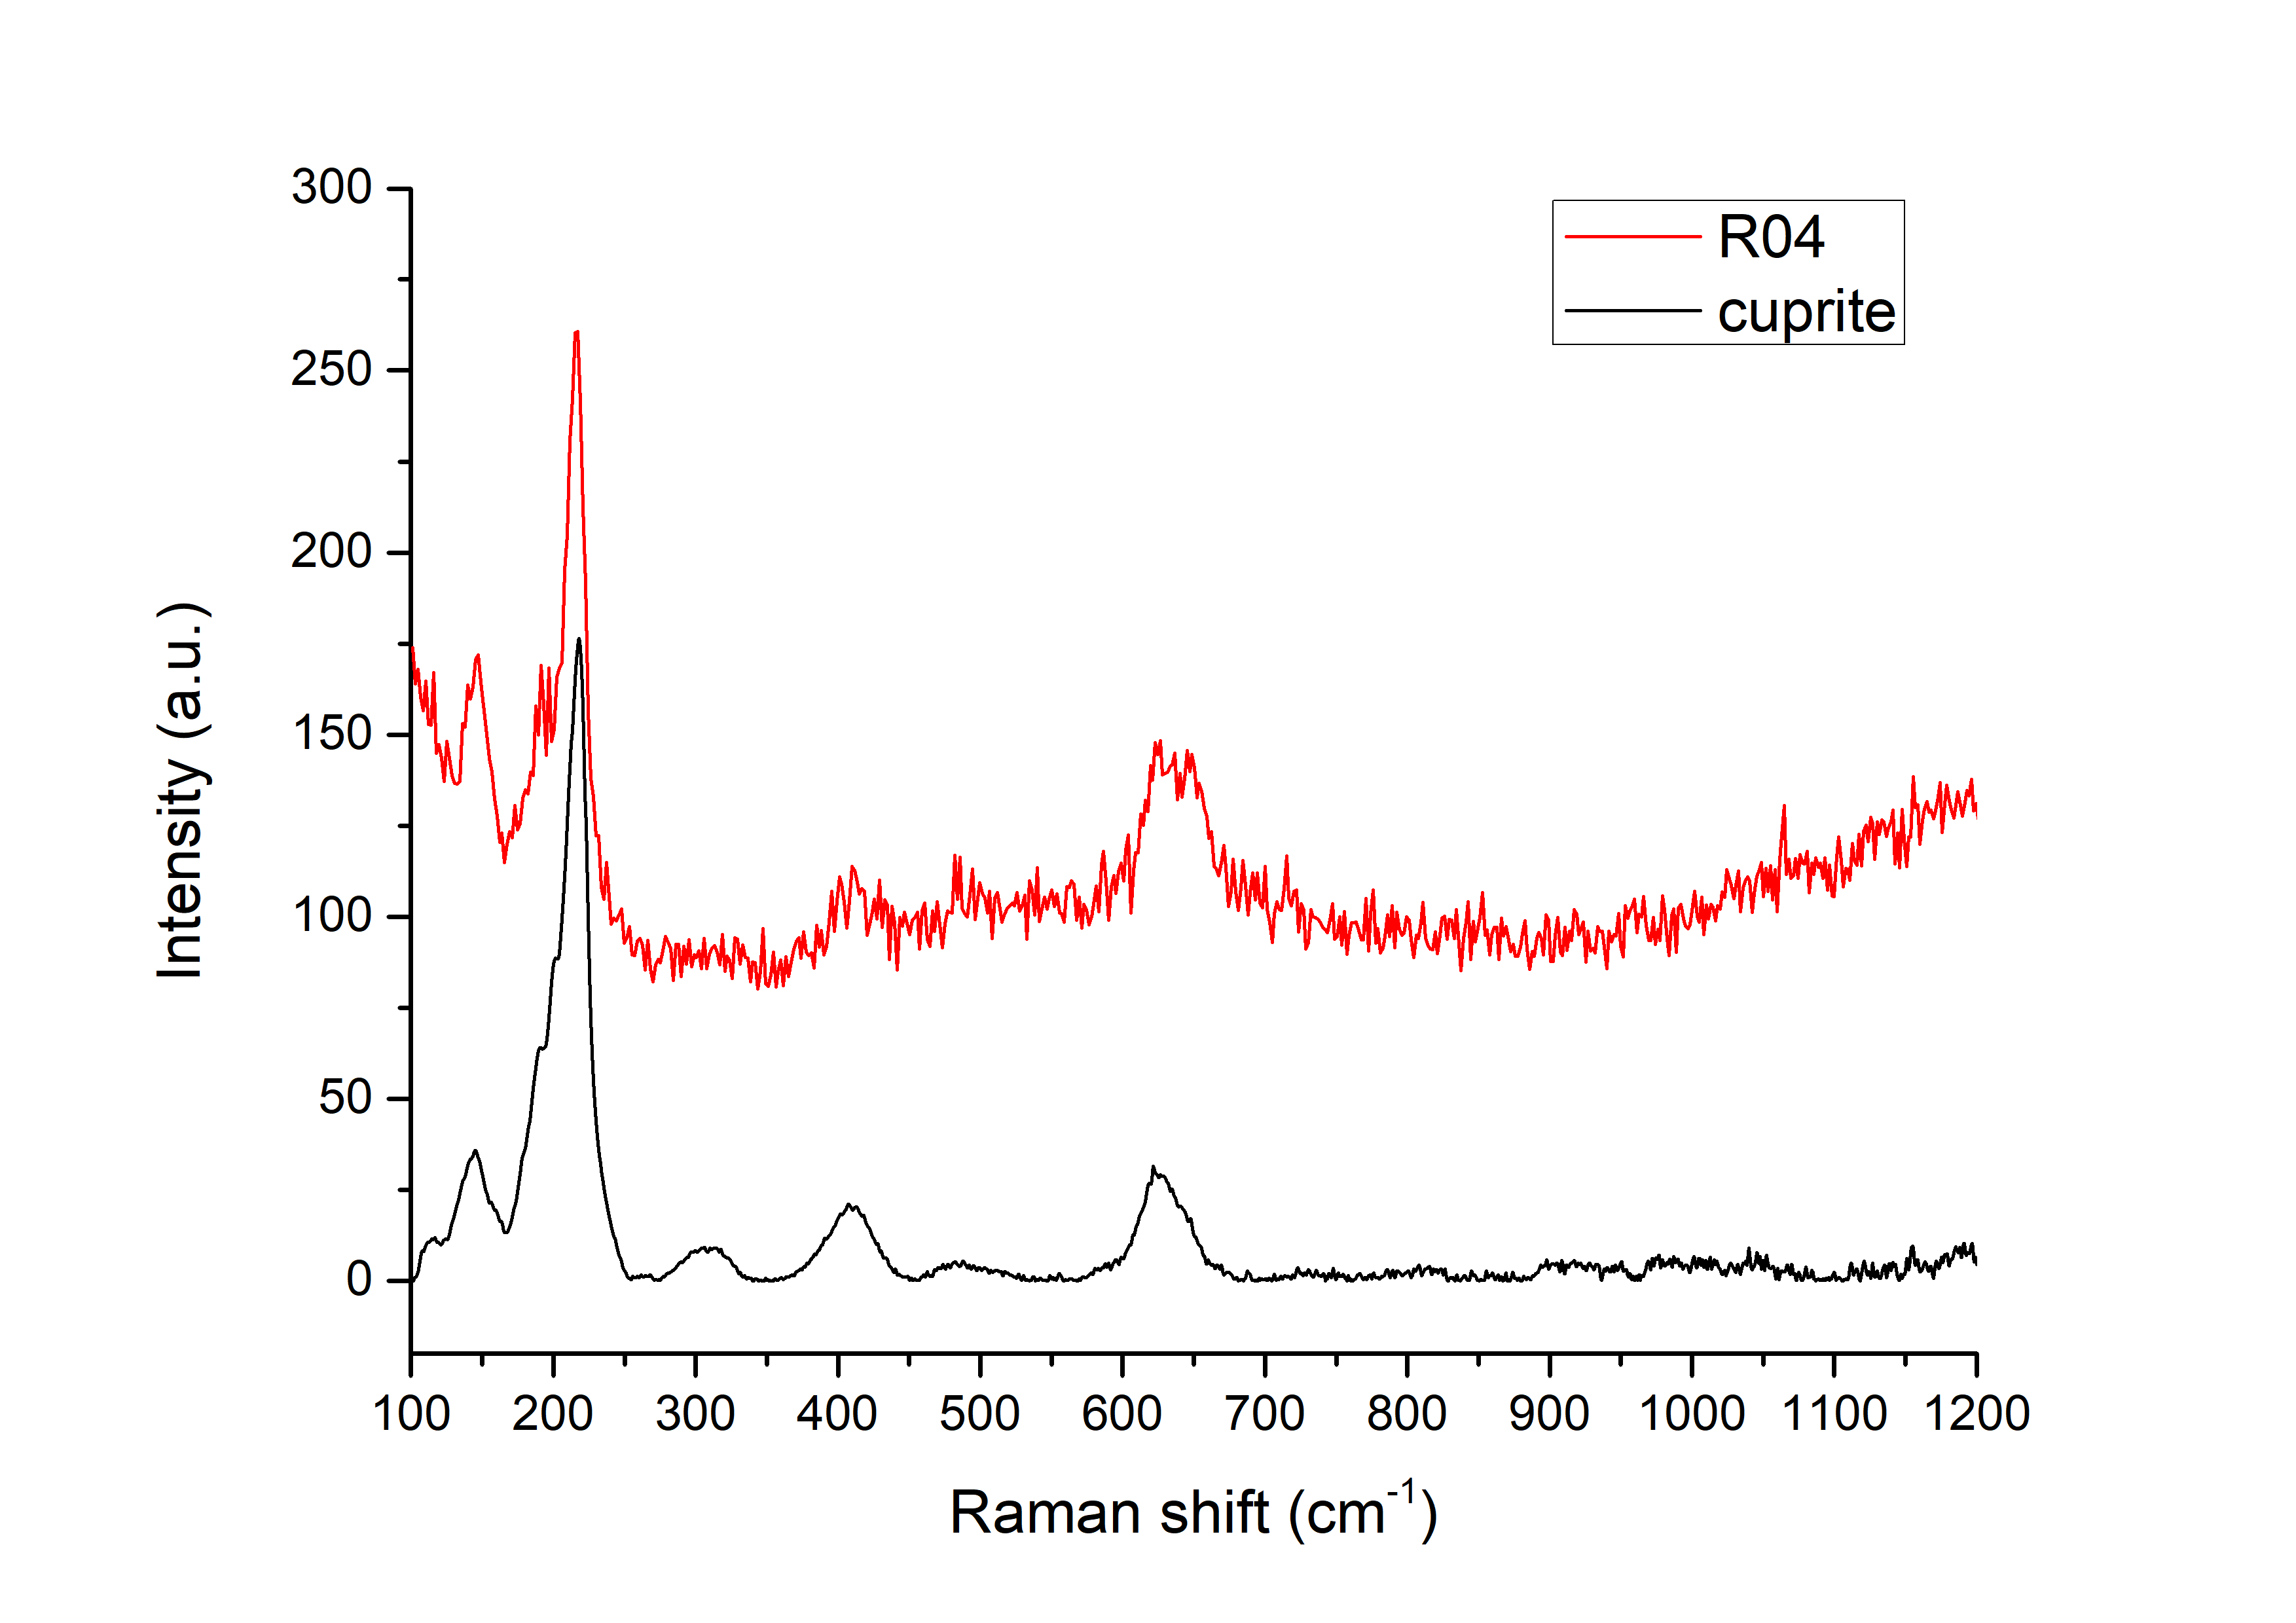
XRD (Figs. 10-12) and Raman analyses (Figs. 13-16) allowed to identify different compounds of the corrosion structure. The CP2 stratum is composed of cassiterite (SnO2). CP3 was identified as the hydroxicarbonate azurite Cu3(CO3)2(OH)2. CP4 is composed of mushistonite (a mixed Cu/Sn hydroxide with general formula Cu2+Sn4+(OH)6), together with localized presence of the hydroxicarbonate malachite Cu2(CO3)(OH)2 in the more external part close to CP3, while the red areas and the black spots inside CP4 are identified respectively as cuprite Cu2O and (silver-bearing) covellite CuS.
| wt% | CP1 | CP2 | CP3 | CP4 | CP4 black spots |
| Sn | 53 | 54 | 27 | 36 | 1 |
| Cu | 10 | 9 | 38 | 28 | 55 |
| O | 31 | 31 | 33 | 34 | 2 |
| Al | 2 | 1 | <0.5 | 0 | 0 |
| Si | 1 | 2 | <0.5 | 0.5 | <0.5 |
| Ag | <0.5 | <0.5 | <0.5 | <0.5 | 11 |
| S | 0 | <0.5 | <0.5 | 0.0 | 29 |
| Pb | 1 | 1 | <0.5 | <0.5 | 0 |
| As | <1 | <1 | <0.5 | <0.5 | <0.5 |
| Fe | <1 | <0.5 | <1 | <0.5 | <0.5 |
| P | <0.5 | <0.5 | <0.5 | <0.5 | 0 |
| Cl | <0.5 | <0.5 | 0 | <0.5 | 0 |
Table 3: Chemical composition (wt%) of the corrosion layers over a general area of analysis in cross-section obtained by SEM-EDX, LMC-IRAMAT-CNRS-UTBM.
 Credit LMC-CNRS, V. Valbi.
 Credit LMC-CNRS, V.Valbi.
 Credit LMC-CNRS, V.Valbi.
 Credit LMC-CNRS, V.Valbi.
 Credit LMC-CNRS, V.Valbi.
Uniform
Unknown
None.
The stratigraphies obtained by binocular and cross-section observation show a few differences. The blue, green and black CPs 1, 2 and 3 observed in binocular stratigraphy are not present in the cross-section stratigraphy. The location of sampling (Fig. 2) being different from the location of binocular observation can explain their absence in the sample taken. The CP4 observed under binocular microscope (Bi) probably could correspond to the olive green CP1 observed in cross-section (CS). CP5 observed under Bi could be the CP2 in CS. CP6 observed under Bi can correspond to the blue CP3 observed in CS. The light green CP7 under Bi shows a direct correspondence with the light blue CP4 identified in CS. The difference in the identified colours can be explained by the different perceptions of colours with the two observation modes and the operator bias. A CM was observed in CS, but was not documented in Bi.
The winged axe has a low-tin bronze composition (8 mass% Sn) with sulfide inclusions that are typical of metallurgical processes of copper smelting from chalcopyrite-based minerals (Artemyev et al. 2019, Addis et al. 2015, Artioli et al. 2015). The metal microstructure revealed that the object underwent cold-working and annealing (final step). The metallography of this artefact can be compared to similar artefacts previously studied by Gabillot et al. 2021.
The corrosion products show the common decuprification phenomenon with associated tin enrichment leading to the formation of tin oxides and oxy-hydroxides such as cassiterite for CP4 (Robbiola et al. 1998, Ospitali et al. 2012) and mushistonite for CP2. Cuprite islets were also identified inside the cassiterite CP4 stratum, close to the interface with the metal, as well as S-rich inclusions identified as covellite (CuS). These sulfide inclusions in the CP are probably caused by the presence of sulfide inclusions in the original metal and do not come from the surrounding environment. Hydroxi-carbonates such as malachite and azurite are identified as well in the corrosion structure.
Documentation of this object was initiated because it suffers from a particular flaking corrosion. A possible explanation for this phenomenon might be the specific morphology of the corrosion strata, which appear powdery under binocular observation and strongly cracked and porous under cross-section observation. This results in poor adhesion of the corrosion strata and the flaking. Comparison with other objects with similar conservation problems may give new insight into this problem.
References on analytical methods and interpretation
1. Lafuente, B., Downs, R. T., Yang, H., Stone, N. (2015) The power of databases: the RRUFF project. In: Highlights in Mineralogical Crystallography, T. Armbruster and R. M. Danisi, eds. Berlin, Germany, W. De Gruyter, 1-30.
2. Ospitali, F., Chiavari, C., Martini, C., Bernardi, E., Passarini, F., Robbiola, L. (2012) The characterization of Sn-based corrosion products in ancient bronzes: a Raman approach. Journal of Raman Spectrpscopy, 43 (11), 1596-1603.
3. Robbiola L., Blengino M., Fiaud C., (1998) Morphology and mechanisms of formation of natural patinas on archaeological Cu–Sn alloys. Corrosion Science, 40 (12), 2083-2111.
4. Scott, D. (2006) Metallography and microstructure of ancient and historic metals. J Paul Getty Museum Publications.
5. Artemyev D. A., and Maksim N. A. (2019). Trace Elements of Cu-(Fe)-Sulfide Inclusions in Bronze Age Copper Slags from South Urals and Kazakhstan: Ore Sources and Alloying Additions. Minerals 9, no. 12: 746.
6. Addis, A.; Angelini, I.; Nimis, P.; Artioli, G. Late Bronze Age copper smelting slags from Luserna (Trentino, Italy): Interpretation of the Metallurgical Process. Archaeometry 2015, 58, 96–114.
7. Artioli, G.; Angelini, I.; Tecchiati, U.; Pedrotti, A. Eneolithic copper smelting slags in the Eastern Alps: Local patterns of metallurgical exploitation in the Copper Age. J. Archaeol. Sci. 2015, 63, 78–83.
8. Gabillot M. Métallurgistes en France orientale au Bronze moyen. Nouvelles analyses physico-chimiques et morphométriques, 2021.