Coin CdN 2012-1-55
Naima. Gutknecht (HE-Arc CR, Neuchâtel, Neuchâtel, Switzerland) & Valentina. Valbi (Laboratoire Métallurgie et Culture (LMC), Belfort, Franche-Comté, France) & Rey-Bellet. Bernadette (Musée d'art et d'histoire, Genève, Genève, Geneva, Switzerland)
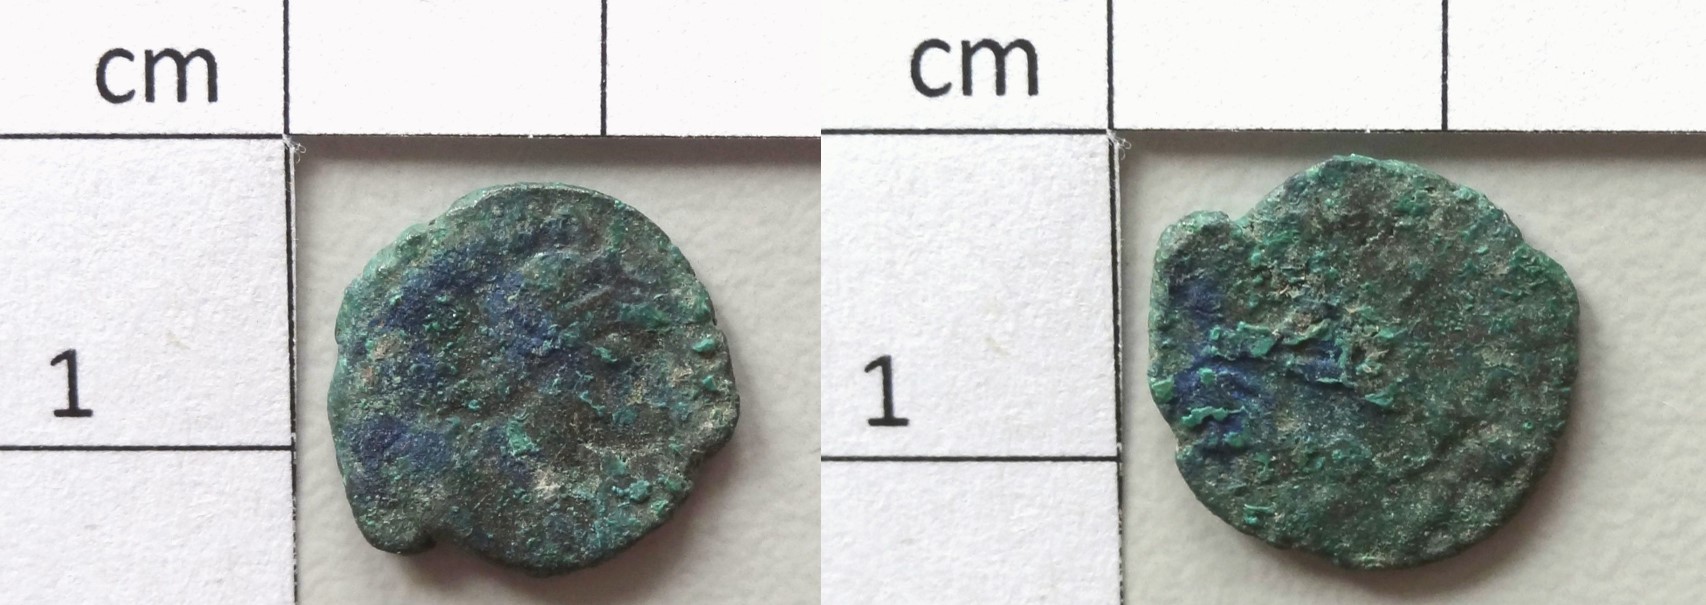
Coin with blue and green corrosion products. Identification as Honorius, Western Roman Emperor (393-423). The coin is probably an imitation. Dimensions: about 1.5cm in diameter.
coin
Peney, Genève, Geneva, Switzerland
1960
Late roman times
Soil
Musée d'art et d'histoire, Genève, Geneva
Musée d'art et d'histoire, Genève, Geneva
CdN 2012-1-55
No conservation treatement reported
Object recovered in 1960 at Peney, Geneva, Switzerland in a hoard containing 4000 coins. Around 1400 coins from the hoard are conserved at the Art and History Museum of Geneva.
 Credit MAHG, B.Rey-Bellet/ HE-Arc CR, N.Gutknecht.
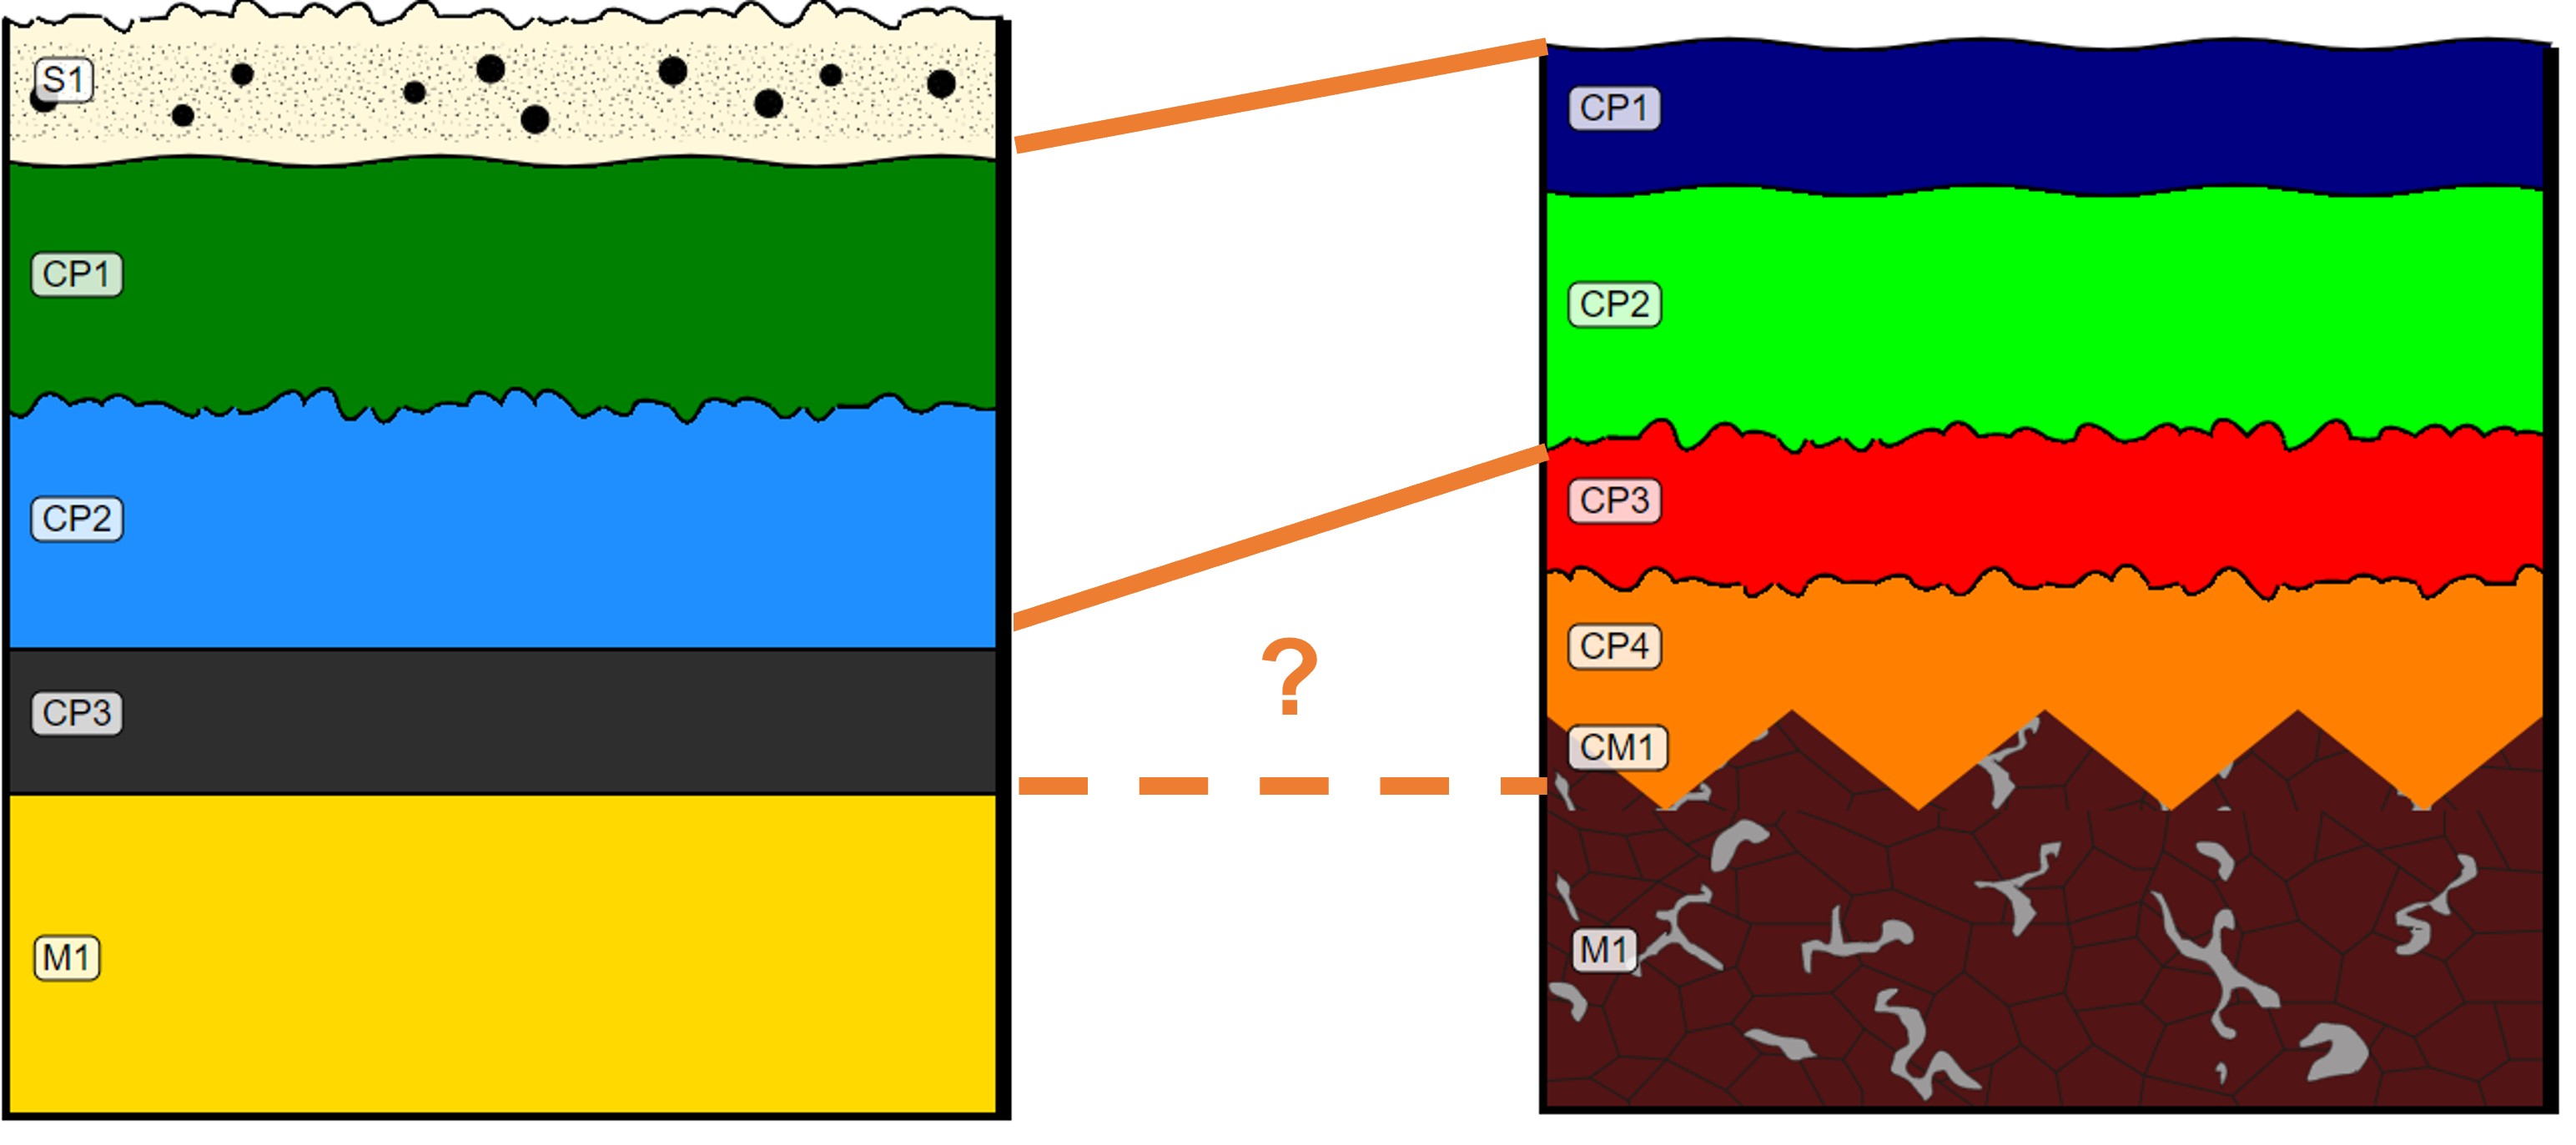
The schematic representation below gives an overview of the corrosion structure encountered on the coin from a first visual macroscopic observation.
| Stratum | Type of stratum | Principal characteristics |
| S1 | Soil | Cluster, light grey, thin, scattered, non-compact, soft |
| CP1 | Corrosion product | Cluster, dark green, medium, scattered, compact, very soft |
| CP2 | Corrosion product | Cluster, blue, medium, scattered, compact, very soft |
| CP3 | Corrosion product | Layer, black, thin, continuous, compact, soft |
| M1 | Metal | Dark yellow, metallic, soft |
Table 1: Description of the principal characteristics of the strata as observed under binocular and described according to Bertholon's method.
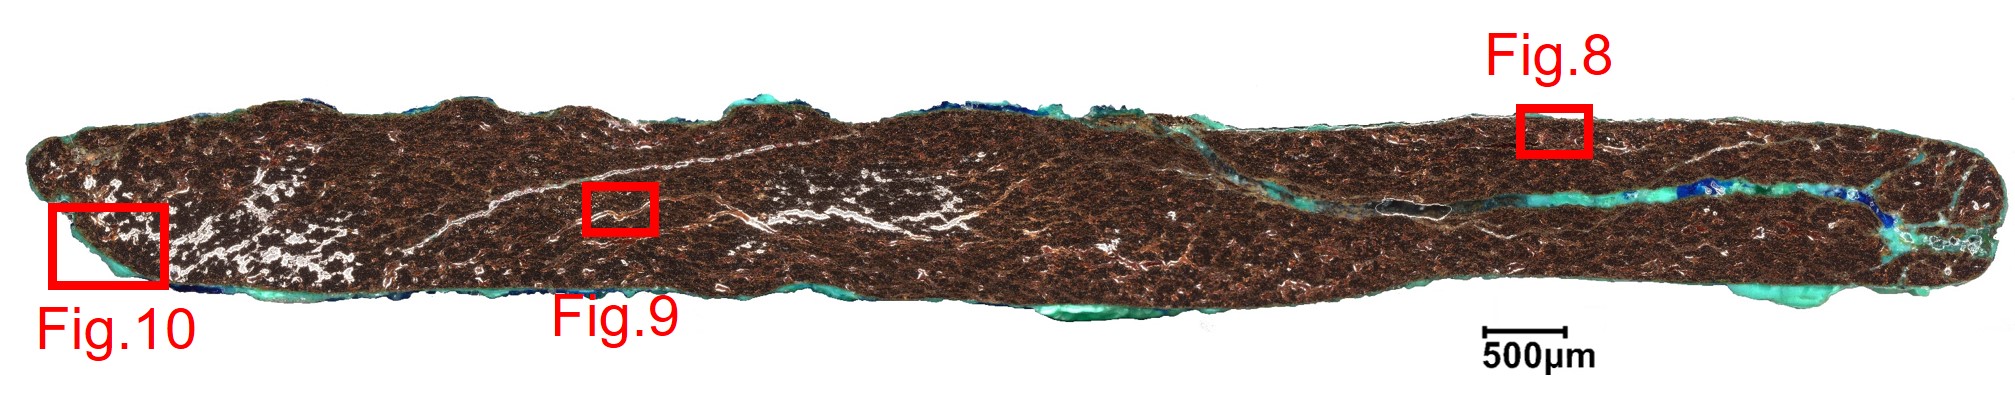
The cross-section corresponds to a cut of the coin in half (Fig. 2) and is representative of the entire thickness of the coin's body. A metallic core is present below the corrosion layers (Fig. 6).
Cu Alloy
Annealed after cold working
BL55
None
Musée d'art et d'histoire, Genève, Geneva
June 2021
None.
Analyses performed:
Non-invasive approach
- XRF with handheld portable X-ray fluorescence spectrometer (NITON XL3t 950 Air GOLDD+, Thermo Fischer®). General Metal mode, acquisition time 60s (filters: Li20/Lo20/M20).
Invasive approach (on the sample)
- Optical microscopy: the sample is polished, then it is observed with a numerical microscope KEYENCE VHX-7000 in bright and dark field.
- Metallography: the polished sample is etched with alcoholic ferric chloride and observed by optical microscopy in bright field.
- SEM-EDS: the sample is coated with a carbon layer and analyses are performed on a SEM-FEG JEOL 7001-F equipped with a silicon-drift EDS Oxford detector (Aztec analysis software) with an accelerating voltage of 20 kV and probe current at about 9 nA. The relative error is considered of about 10% for content range <1mass%, and of 2% for content range of >1mass%.
- µ-Raman spectroscopy: it is performed on a HORIBA Labram Xplora spectrometer equipped with a 532 nm laser with 1800 grating, the laser power employed is between 0.04 and 0.55 mW with acquisition time varying between 1 and 5 minutes.
The XRF analysis of coin CdN 2012-1-55 was carried out before sampling. All strata, from soil and corrosion products to metal, are analyzed at the same time. The metal is presumably a copper-lead-tin alloy, while the other elements detected (Fe, Si, Al) are from the environment.
| Elements | mass % |
| Cu | 69 |
| Pb | 25 |
| Sn | 1 |
| Sb | <1 |
| Fe | <1 |
| Si | 2 |
| Al | 2 |
Table 2: Chemical composition of the surface of coin CdN 2012-1-55. Method of analysis: XRF, General Metal mode, acquisition time 60s (filters: Li20/LO20/M20). The results are rounded up to the nearest whole number, UR-Arc CR.
EDX analysis (Table 3) of the residual metal on cross-section of sample BL55 indicates that it is a Cu-Pb-Sn ternary alloy with a high percentage of Pb (29 wt%). This confirms XRF analysis (Table 2).
| Elements | wt% |
| Cu | 67 |
| Pb | 29 |
| Sn | 2 |
Table 3: Chemical composition (wt%) of the alloy over a general area of analysis, LMC-IRAMAT-CNRS-UTBM.
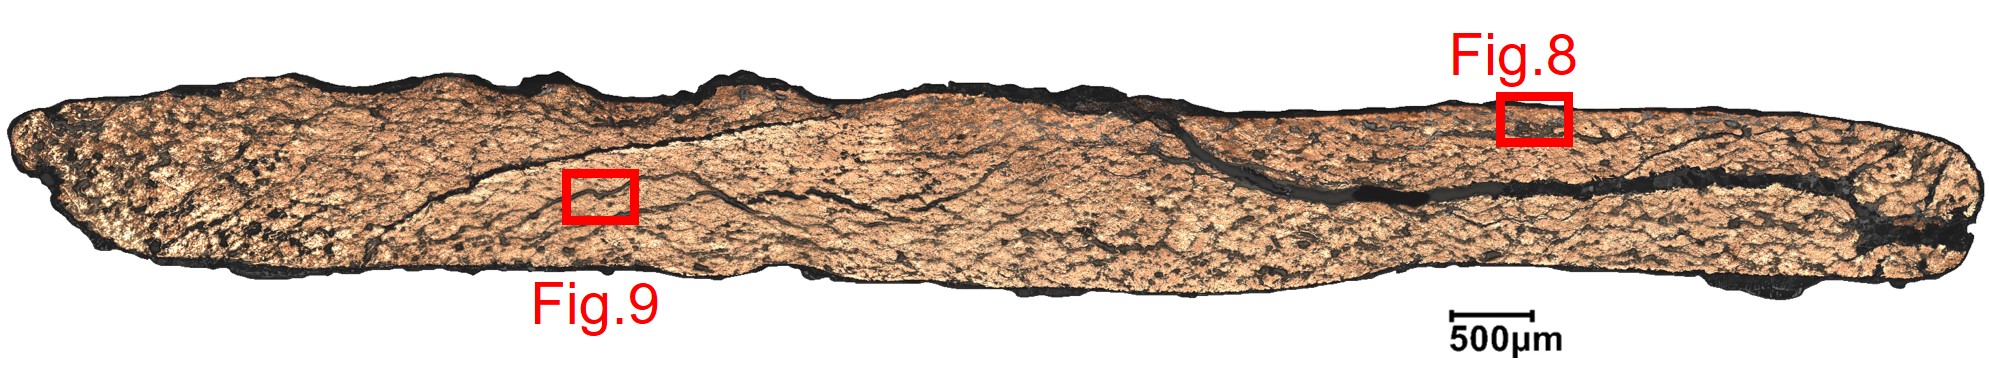
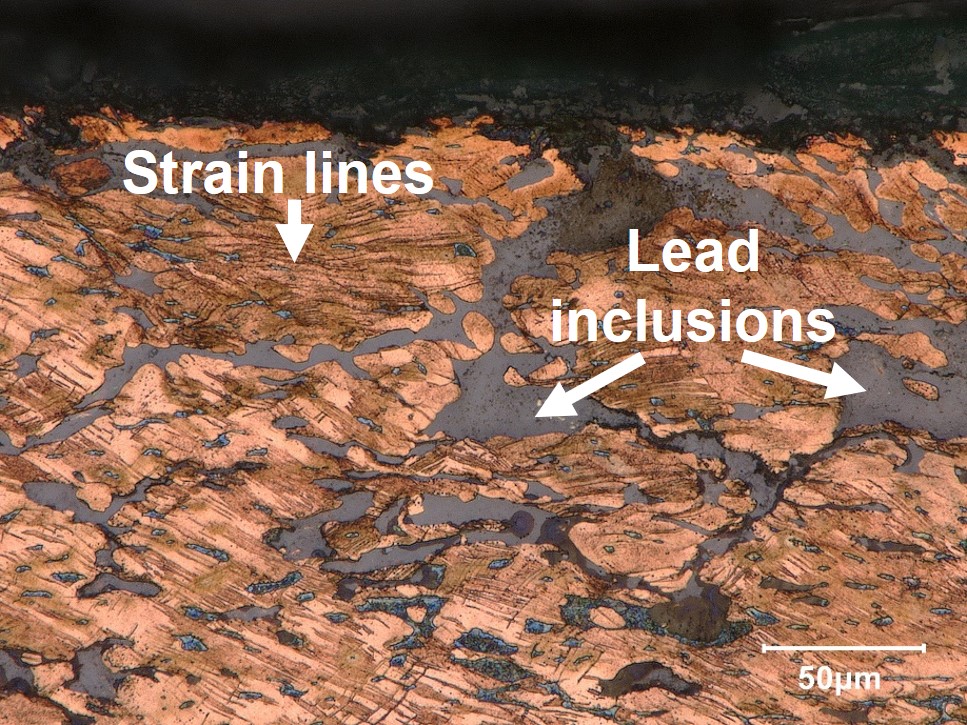
The sample presents on its whole thickness big Pb inclusions (50-100 μm, Figs. 7 and 8) homogeneously distributed. The metal has a polygonal grain structure (Figs. 8-9) with locally elongated grains and slip lines revealing that the object underwent cold working. Several longitudinal cracks are observed and are filled with corrosion products (Fig. 9).
 Credit LMC-CNRS, V. Valbi.
 Credit LMC-CNRS, V. Valbi.
Polygonal grains with inclusions
Cu
Sn, Pb
None.
The observation of the sample in cross-section in dark field mode shows the presence of an external blue CP1 layer with sand inclusions, on top of a green CP2 layer, then a red thin internal CP3 layer and an orange CP4 also present in the inclusions inside the corroded metal (Fig. 10).
The EDX elemental analysis (Table 4, Fig.11) of the visually identified CPs by cross-sectional observation shows that the external CP1 and CP2 are Cu-based products with only few amounts of lead (3 wt %), while the orange CP4 is a lead-based compound.
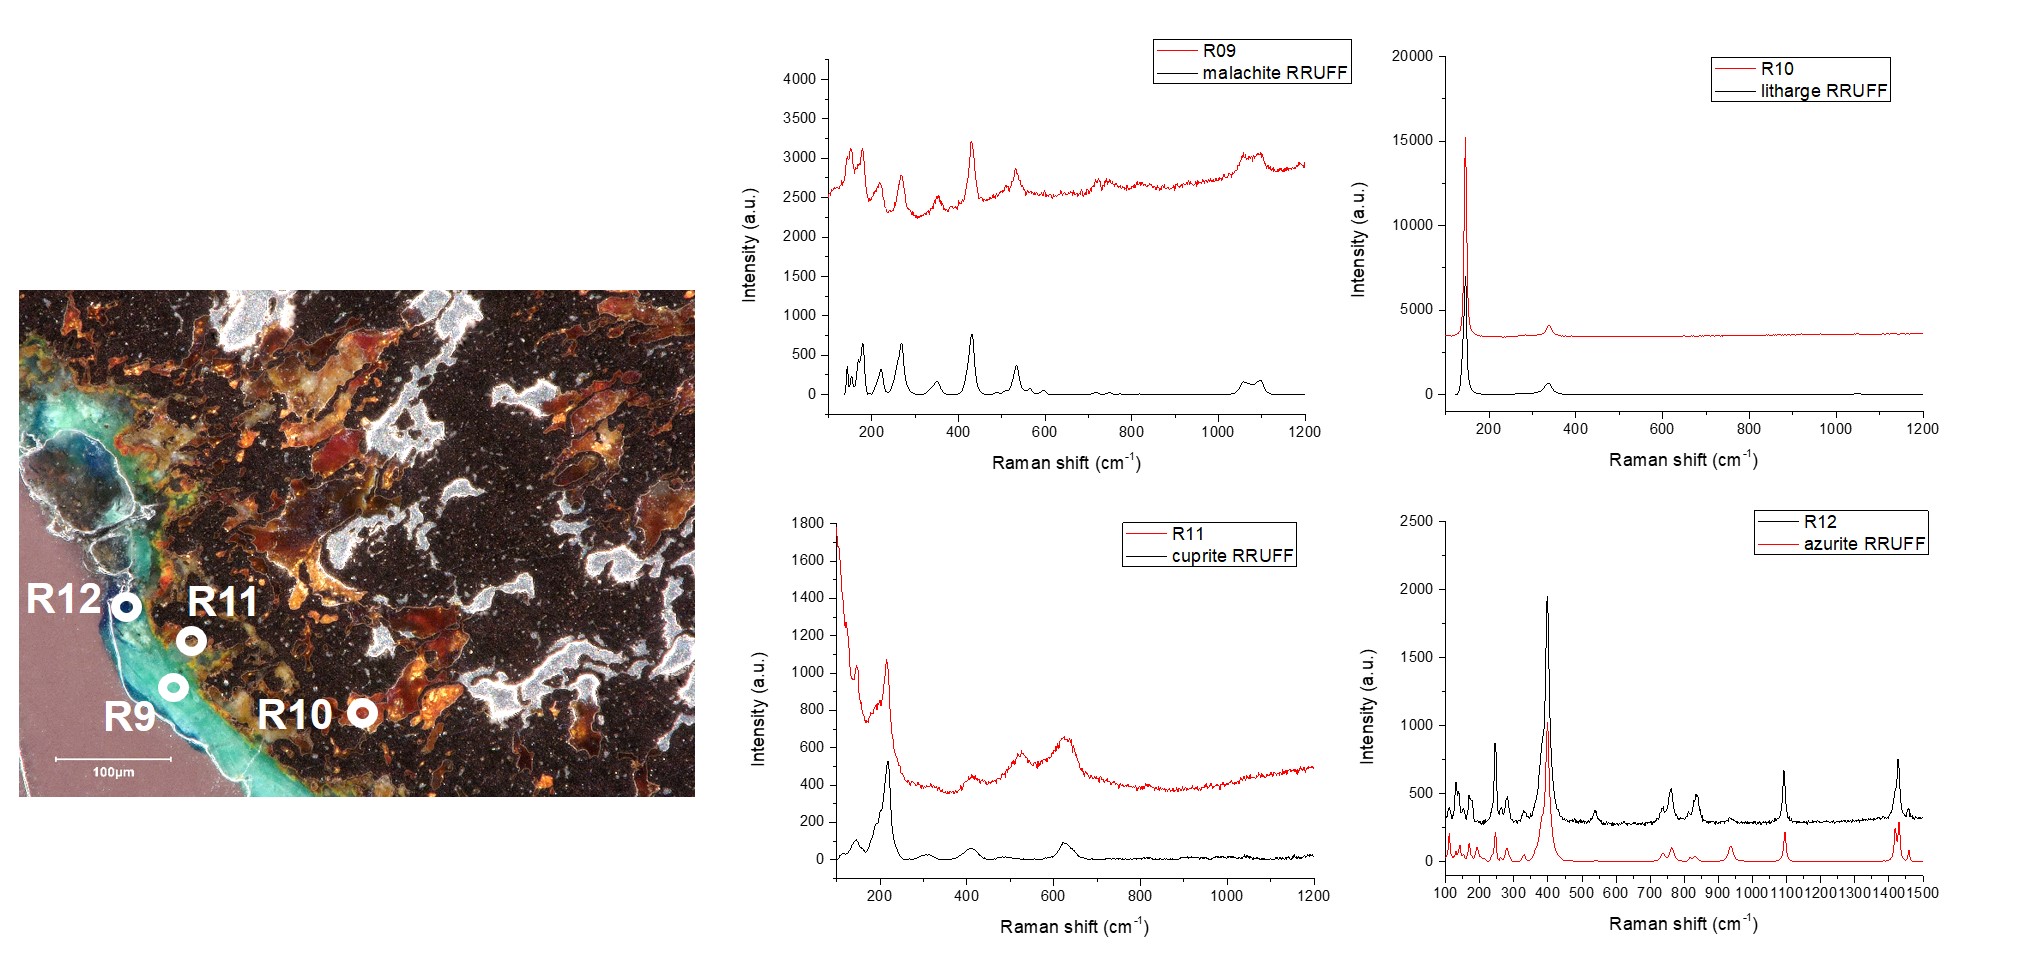
µ-Raman analyses were performed on the identified strata when possible (Fig. 12). The R12 point of analysis was performed on the blue CP1 layer and the corresponding spectrum presented the typical main peaks of azurite (Cu3(CO3)2(OH)2), The R9 point of analysis in the green CP2 layer shows the typical peaks of malachite (Cu2(CO3)(OH)2). The R11 point of analysis was performed on the red thin CP3 layer and shows the main peaks of cuprite (Cu2O), while the R10 point of analysis was performed on the internal orange corrosion products and showed the typical peaks of litharge (PbO).
| Elements | CP1 | CP2 | CP4 |
| O | 29 | 29 | 5 |
| Cu | 68 | 69 | 1 |
| Pb | 3 | 3 | 94 |
Table 4: Chemical composition (wt %) of the corrosion layers over a general area of analysis in cross-section, LMC-IRAMAT-CNRS-UTBM.
 Credit LMC-CNRS, V. Valbi.
 Credit LMC-CNRS, V. Valbi.
Multiform - selective
None
None.
The stratigraphies obtained by binocular and cross-section observation show a few differences that can be attributed to the different scales of observation. In fact, under binocular it is possible to differentiate strata according to texture and light colour changes that do not always correspond to changes in chemical composition, thus leading to a regrouping of several strata into one according to the cross-section observation and physicochemical characterization.
The strata S1 observed in binocular is lacking in cross-section observation, probably due to a different observation location. The CP1 and CP2 layers observed by binocular probably correspond to the CP1 and CP2 observed in cross-section, but with the green and the blue layer inversed. The blue CP2 layer observed in binocular mode could correspond to the blue CP1 observed in cross-section and the green CP1 in binocular to the green CP2 in CS. This could be explained as well by the different locations of the observations carried out. Finally, the red cuprite CP3 and the orange litharge CP4 observed in cross-section as well as the corroded metal strata CM1 observed in cross-section were not clearly identified by binocular observation. Still, they could be linked to the black CP3 layers that can not be linked with certainty to any strata in cross-section, but probably a regrouping of CP3, CP4 and CM1. The binocular view rarely allows documenting CM strata, as the transition between layers is difficult to assess.
M1 could be documented with great accuracy in cross-section and give multiple information about the internal structure of the metal.
The coin is composed of a Cu-Pb-Sn ternary bronze alloy with high Pb percentages (29 wt%). Pb is not soluble in the bronze metallic structure and large lead inclusions are observed throughout the whole metal thickness. The metallic microstructure reveals that the object underwent cold working. The whole object is fragilised by the presence of longitudinal cracks filled with corrosion products.
The external corrosion products are composed of Cu-based hydroxycarbonate (azurite and malachite) formed by redeposition of copper with the carbonate ions from the burial environment. Cuprite (Cu2O) is also identified at the metal interface and is the first corrosion product usually formed on bronzes, while lìtharge (PbO) is observed in the corroded metal stratum, replacing the lead inclusions selectively attacked.
This coin is part of a corpus of coins found on the same site and called "Peney hoard". Two more coins were studied and have a MiCorr artefact sheet.
References on object and sample
1. MiCorr_coin with white corrosion - Peney hoard.
2. MiCorr_coin with white corrosion localised on the center - Peney hoard.
References on analytical methods and interpretation
3. Lafuente, B., Downs, R. T., Yang, H., Stone, N. (2015) The power of databases: the RRUFF project. In: Highlights in Mineralogical Crystallography, T. Armbruster and R. M. Danisi, eds. Berlin, Germany, W. De Gruyter, 1-30.
4. Scott, D. (2006) Metallography and microstructure of ancient and historic metals. J Paul Getty Museum Publications.
5. Robbiola, L., Blengino, M., Fiaud, C. (1998) Morphology and mechanisms of formation of natural patinas on archaeological Cu–Sn alloys. Corrosion Science, 40 (12), 2083-2111.