Iron-based bar
Christian. Degrigny (HE-Arc CR, Neuchâtel, Neuchâtel, Switzerland) & Mathea. Hovind (University of Oslo, Department of archaeology, conservation and history (IAKH-UiO), Oslo, Oslo, Norway)
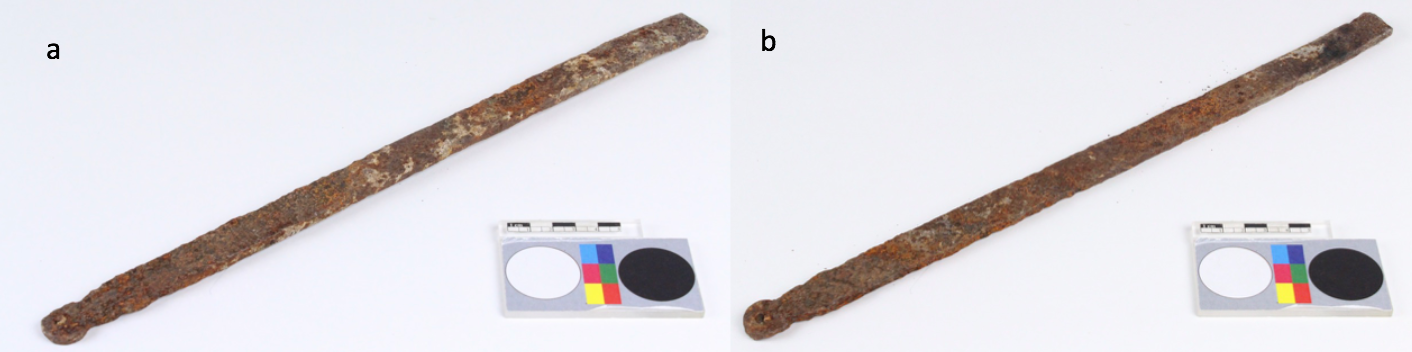
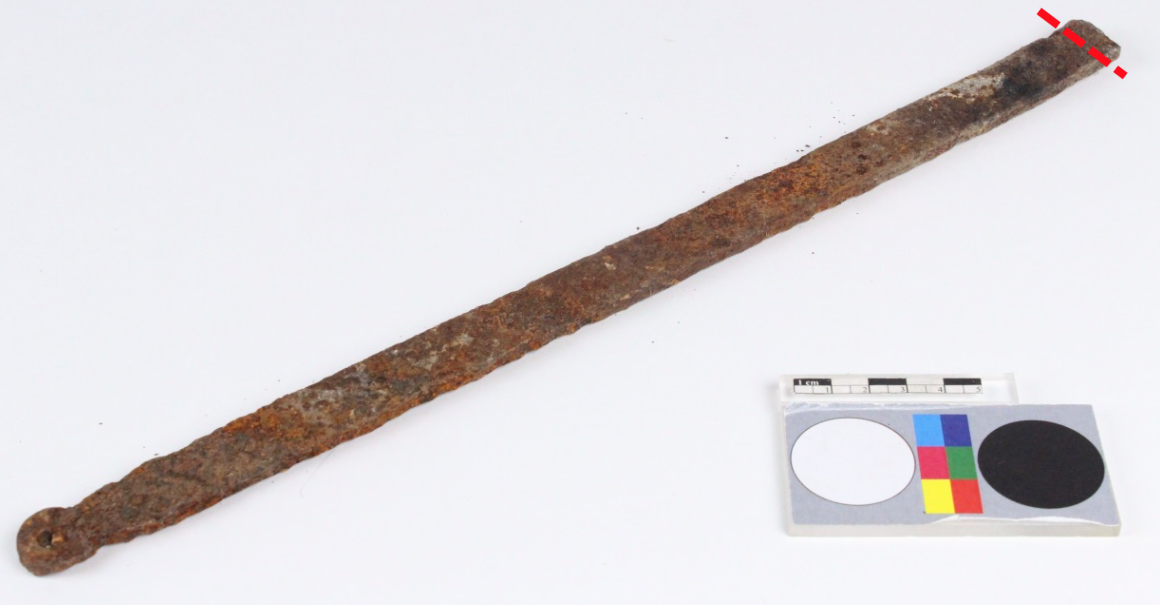
Iron-based bar with a circular pierced tip (Fig. 1). Its surface is covered by brown and orange-red corrosion products in addition to localized deposits of soil and charcoal. Dimensions: L = 374mm; W = 21mm; T = 6mm; WT = 293g.
Not defined
Château de Germolles, Mellecey, Bourgogne, France
Unknown
Modern Times
19th - 20th century
Outdoor atmosphere
Haute Ecole Arc Conservation-Restauration
Château de Germolles, Mellecey, Bourgogne
No inventory number.
Not conserved
Nothing to report.
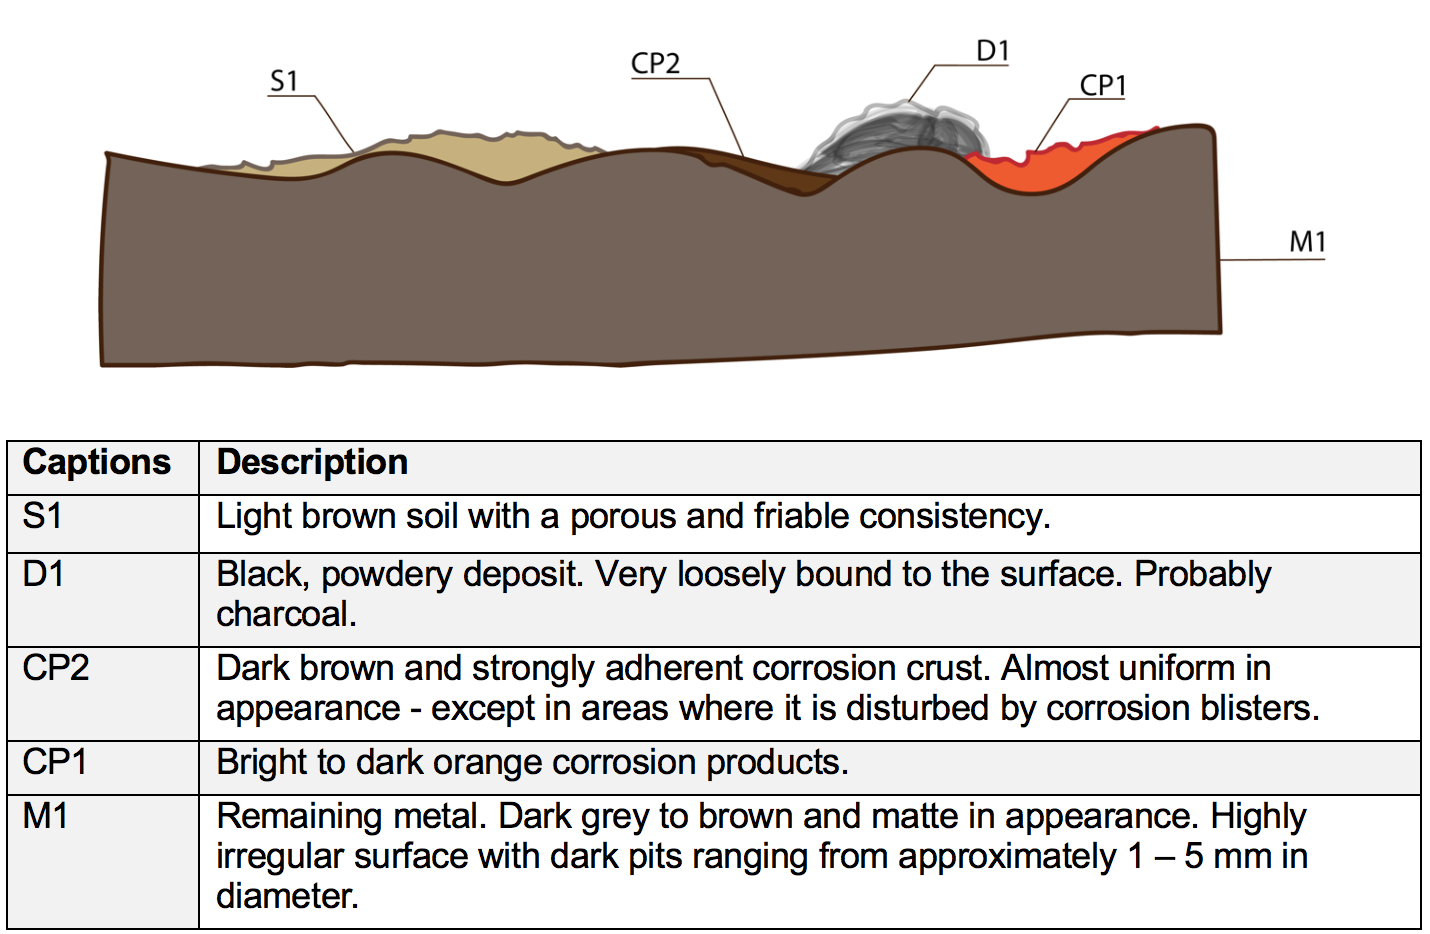
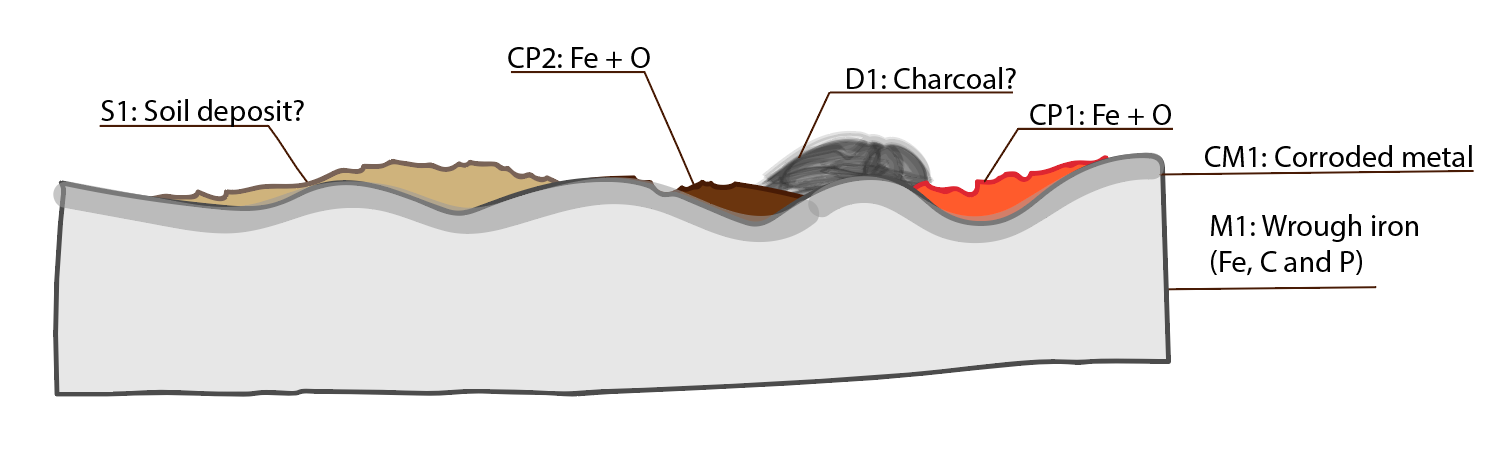
The schematic representation below (Fig. 3) gives an overview of the corrosion layers encountered on the object from a first visual macroscopic observation.
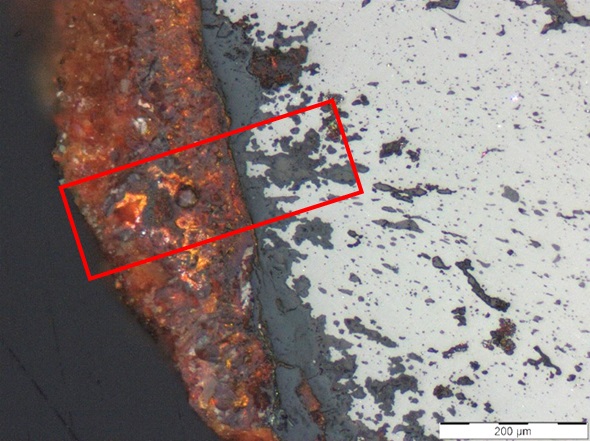
A rectangular section (Fig. 4) was cut out from the tip of the iron bar. Its longitudinal axis corresponds to the width of the iron bar while the height/thickness of the bar is represented by the vertical axis.
Fe Alloy
None
WIB2018 (Wrought Iron Bar sampled in 2018)
Haute Ecole Arc Conservation-Restauration
Haute Ecole Arc Conservation-Restauration
March 2018, study of corrosion stratigraphy and chemical analyses
The fact that the artefact was considered as test material enabled extensive sampling that would not otherwise be possible.
Analyses performed:
Metallography: microscope: Leica DMi8 (a metallographic, inverted, reflected light microscope) with magnification up to 500X. Camera: Olympus SC50 connected to the software “Olympus Stream”, version 1.9.4. Illumination modes: bright field and cross-polarized light.
SEM-EDS: instrument: Jeol 6400; voltage: 20 kV; working distance: 18 and 24mm; sample preparation: palladium depot.
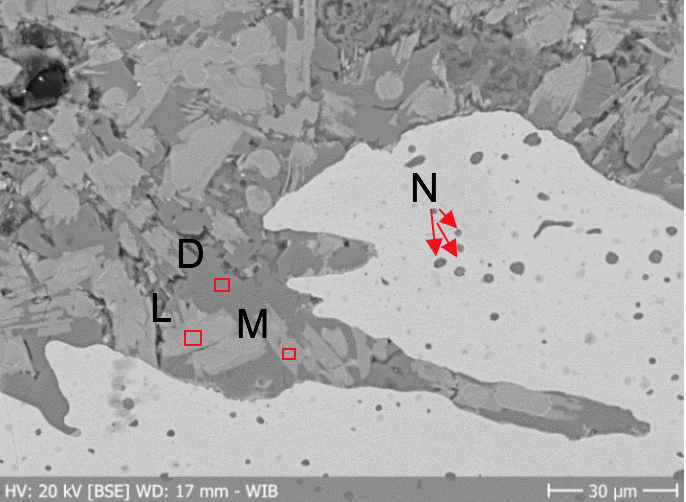
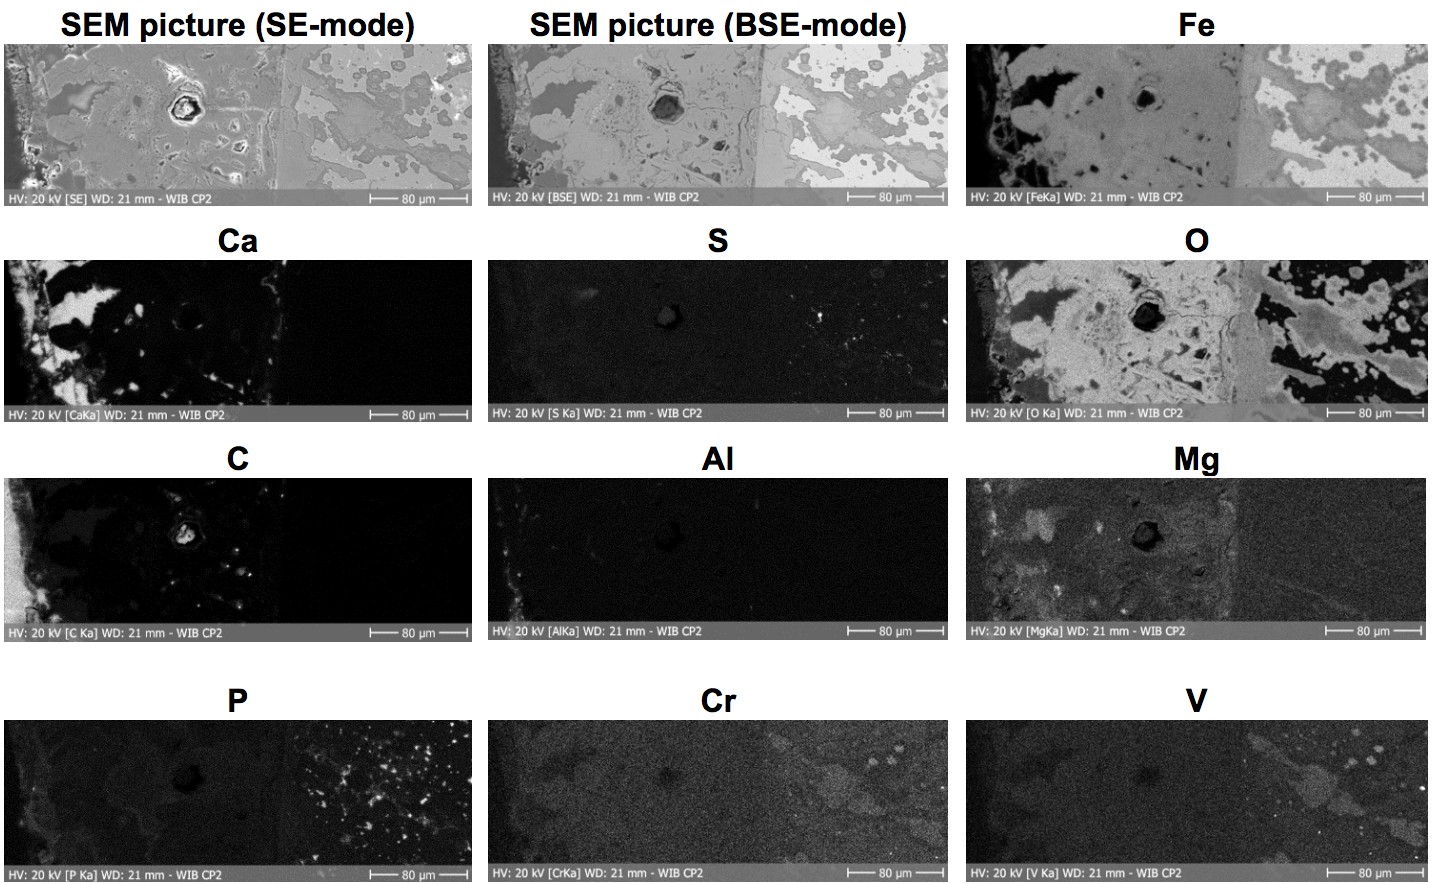
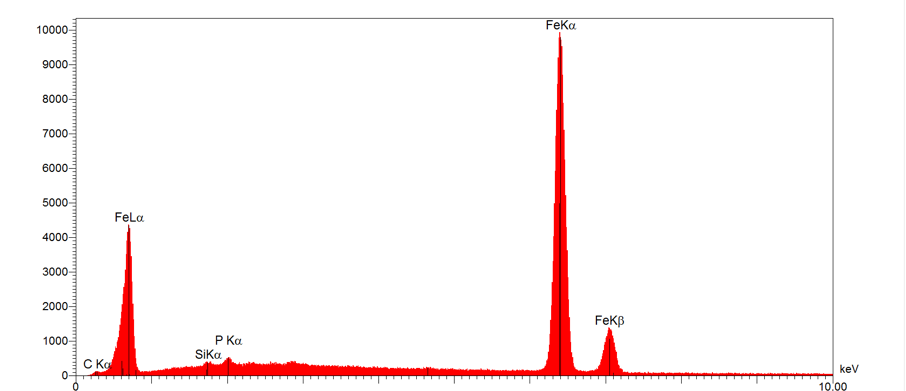
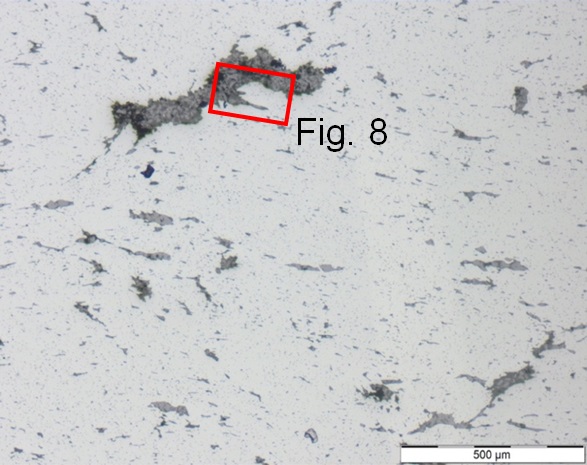
The metal is a wrought iron consisting of Fe, with some P and C (Fig. 6). The presence of Si is due to slag inclusions. The inclusions appear elongated* (Fig. 7) and filled with phases appearing light grey, medium grey and dark grey both in bright field and in SEM in BSE-mode (Figs. 7 and 8). Punctual analysis by SEM-EDS (Table 1) revealed that the light grey phase consists mainly of Fe and O with some C and has a composition similar to Wüstite (FeO). The medium grey phase has a similar composition but contains more P and C in addition to Si (Table 1). This phase is probably Wüstite in a Fe-P matrix. The dark grey phase corresponds to the glassy matrix and contains significally higher concentrations of Si and P, in addition to the usual Fe and O (Table 1). The relatively high Si-content indicates that this phase might be Fayalite (FeSiO4) in a Fe-P matrix.
Smaller inclusions/nodules are evenly distributed throughout the metal (Fig. 7 and 8). They appear dark grey and have a composition similar to the dark grey phase in the elongated inclusions (Table 1).
|
Elements mass % Phase / nodule |
Fe |
O |
P |
Si |
C |
V |
S |
Mn |
Al |
Cr |
Mg |
Ca |
|
Light grey phase |
83
74
52
49 |
12
15
22
27 |
0.1
4
13
11 |
0.2
3
8
5 |
2
3
3
6 |
2
0.8
-
- |
0.1
0.7
0.2
1 |
0.4
0.6
-
0.9 |
0.2
0.3
0.1
0.1 |
0.4
0.1
-
- |
-
-
0.2
- |
-
-
0.1
- |
Table 1: Chemical composition of the different phases in the slag inclusions and the nodules in the metal matrix. Method of analysis: SEM-EDS. Lab. of Electronic Microscopy and Microanalysis, Néode, HEI Arc, credit MiCorr_HEI Arc, C.Csefalvay.
* As the section was cut across the iron bar – it is the cross section of the inclusions that are visible. Thus, their length and direction cannot be deduced directly from the sample.
 Credit HEI Arc, C.Csefalvay.
 Credit UiO-IAKH, M.Hovind.
None
Fe
C, P
Nothing to report.
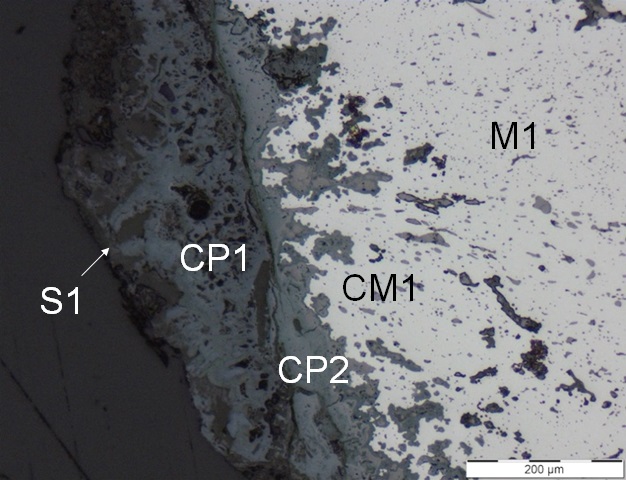
The corrosion crust is relatively thick and consists of two layers: CP1 and CP2. The latter is a dense product layer appearing light grey under both bright field and polarized light (Figs. 9 and 10). The outermost layer (CP1) is a porous crust, appearing dark grey under bright field and bright orange under polarized light (Figs. 9 and 10). The corroded metal (CM1) appears as isolated areas of corrosion within the sound metal.
The composition of the corrosion products shows a varying content of Fe and O throughout the crust with an increasing O-content towards the surface of the corrosion layer CP1 (Table 2). Elemental mapping by SEM-EDS (Fig. 11) shows that Ca and Mg are present in cracks which penetrates the outer corrosion crust (CP1). These elements are probably exogenous and could originate from the layer of soil (S1) that is covering the metal surface.
|
Elements mass % Layer |
Fe |
O |
C |
Ca |
Si |
P |
S |
Mg |
Al |
V |
Cr |
Mn |
|
CP1 |
57 |
36 |
5 |
1.0 |
0.3 |
0.3 |
0.3 |
0.3 |
0.1 |
- |
- |
- |
|
CP2 |
68 |
27 |
3 |
0.5 |
0.4 |
0.4 |
0.1 |
0.1 |
- |
- |
- |
- |
|
CM1 |
70 |
25 |
3 |
0.1 |
0.5 |
0.5 |
0.3 |
0.1 |
0.1 |
0.3 |
0.1 |
0.1 |
Table 2: Chemical composition of the corrosion layers from Figs. 9 and 10. Method of analysis: SEM-EDS. Lab. of Electronic Microscopy and Microanalysis, Néode, HEI Arc, credit MiCorr_HEI Arc, C.Csefalvay.
 Credit UiO-IAKH, M.Hovind.
 Credit UiO-IAKH, M.Hovind.
Pitting
None
Nothing to report.
The schematic representation of corrosion layers integrating additional information based on the analyses carried out in Fig. 12.
 Credit UiO-IAKH, M.Hovind.
Fig. 12: Improved stratigraphic representation of the iron-based bar with results from analyses by SEM-EDS and visual microscopic observation. The colour of the metal was changed to grey as this was the colour of the cross-section of the metal, CP = corrosion product, D = deposit, M = metal S = soil, CM = corroded metal,
The artefact is a wrought iron with evenly distributed inclusions of what appears to be wüstite in a fayalite matrix. Wrought iron containing slags was readily available until World War II, after which it was substituted by low-carbon steels (Selwyn 2004:96). This indicates that the artefact can be dated no later than the first half of the 20th century. As regards the production method, it has been suggested (Dr. Phil. M. Senn, 2018, personal communication the 26th of April) that the artefact was produced by puddling, an indirect process for the conversion of pig iron to wrought iron, while decreasing the level of impurities (Selwyn 2004:112-113).
The corrosion products on the surface of the iron bar are typical for iron exposed outdoors with varying contents of Fe an O in addition to a layer of Ca-containing soil.
| References on object and sample |
|
References sample |
|
References on analytic methods and interpretation |
|
|