Funeral mask IVc 11595
Christian. Degrigny (HE-Arc CR, Neuchâtel, Neuchâtel, Switzerland) & Naima. Gutknecht (HE-Arc CR, Neuchâtel, Neuchâtel, Switzerland) & Valentin. Boissonnas (HE-Arc CR, Neuchâtel, Neuchâtel, Switzerland)
 Credit HE-Arc CR, N. Gutknecht.
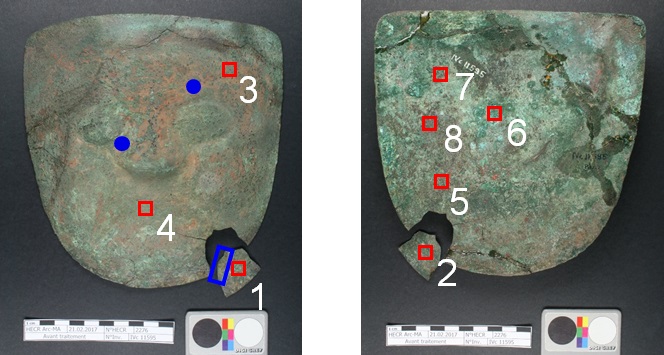
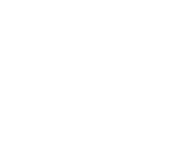
Peruvian funeral mask (Fig. 1). There are remains of red pigment and of a mineralised textile on both sides of the object. It is heavily corroded in green and red corrosion layers. It is deformed and broken. Dimensions: Lenght = 180mm; Width = 170mm; Height = 20 mm; WT = 158,6g.
Funeral mask
Peru, north coast
Date of excavation unknown, acquisition in 1967
None
Tpq: unknown.
Unknown
Museum der Kulturen, Basel
Museum der Kulturen, Basel
IVc 11595
No recorded conservation data.
Nothing to report.
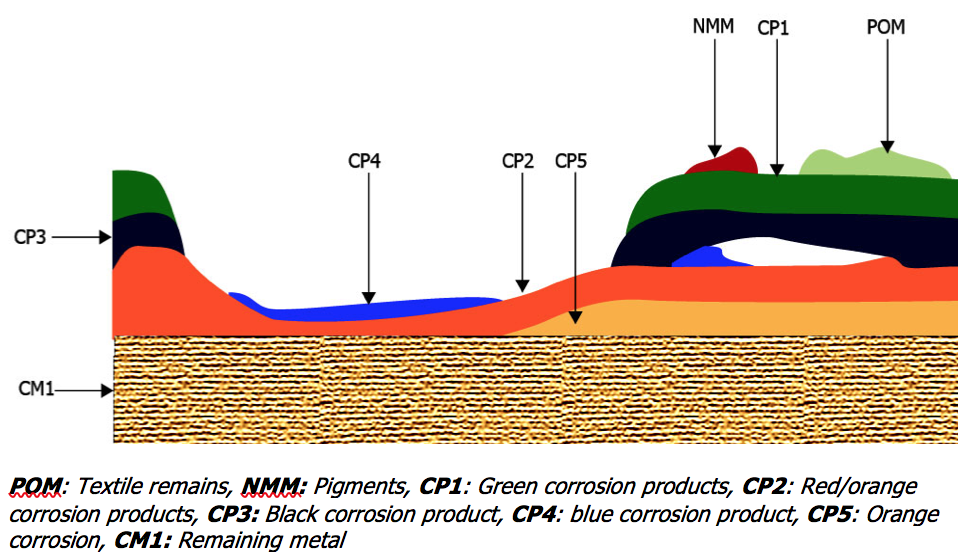
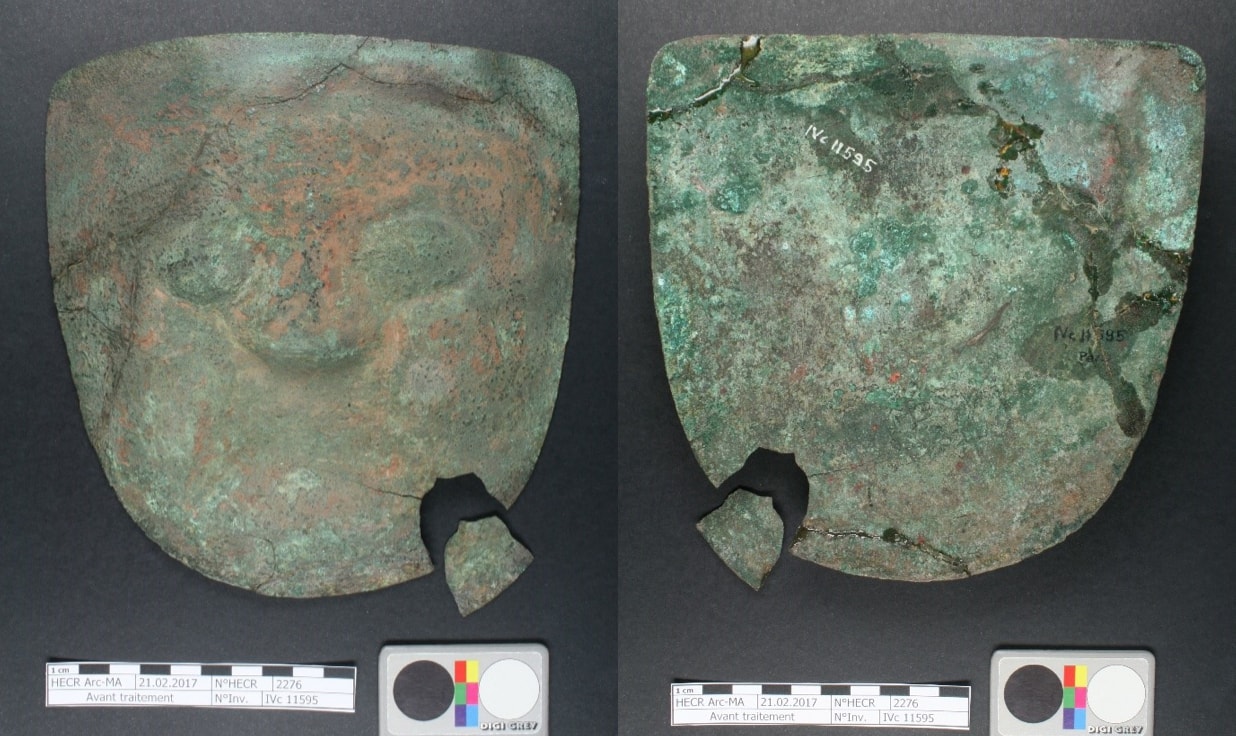
The schematic representation below gives an overview of the corrosion layers encountered on the object from visual macroscopic observation. The first stratigraphy (Fig. 3a) is for the front, while the second (Fig. 3b) represents the back.
 Credit HE-Arc CR, N. Gutknecht.
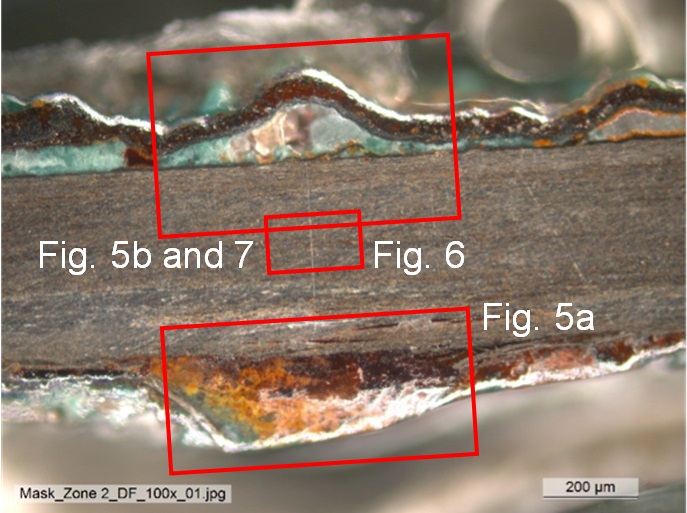
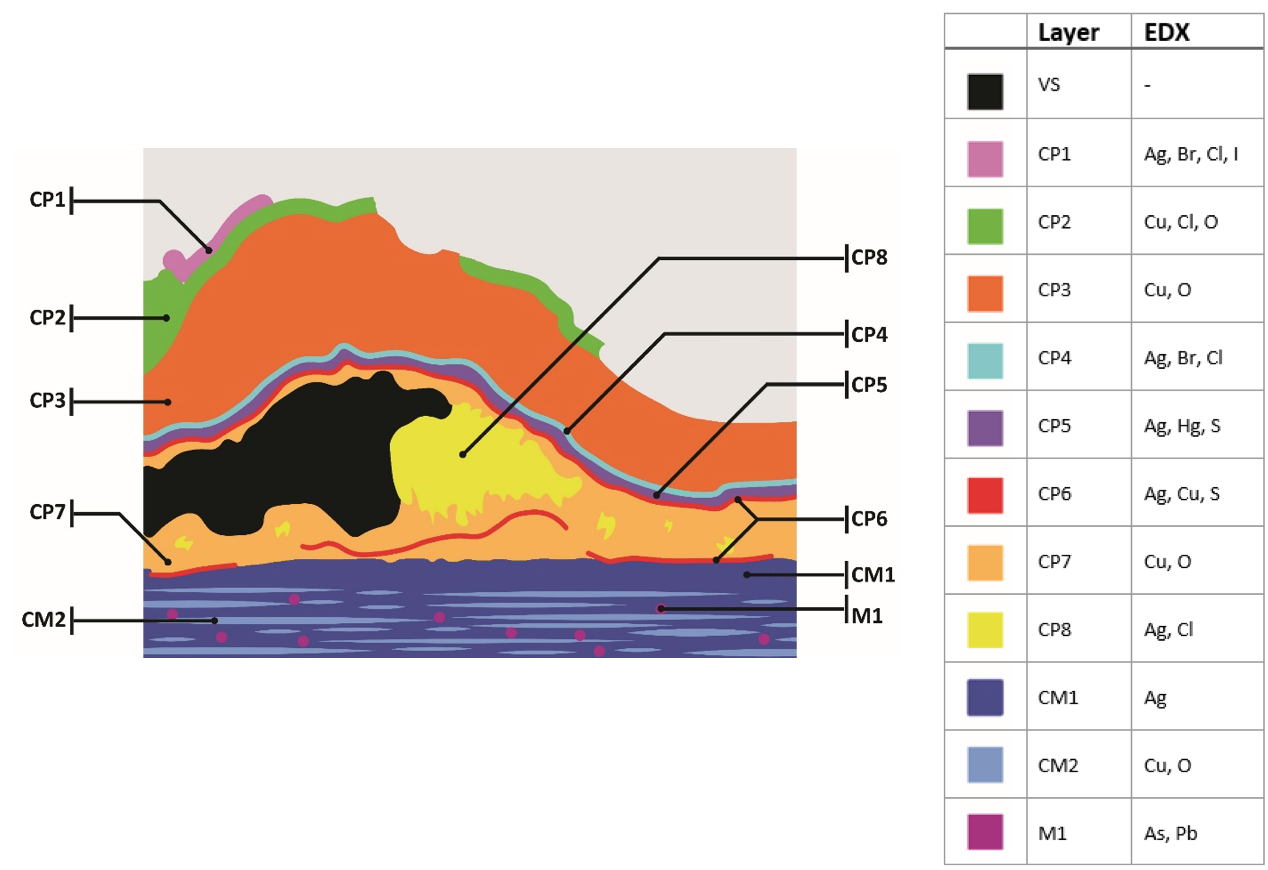
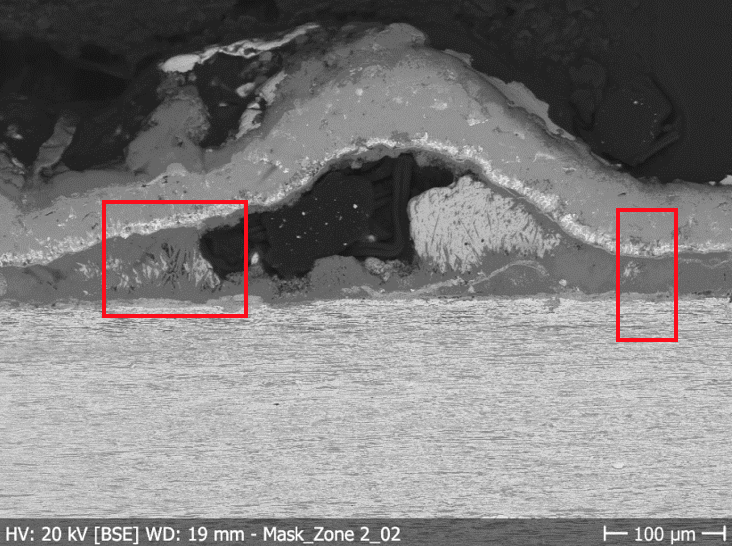
A polished section was made from an already detached fragment that was temporarily embedded in resin (Fig. 2). On Fig. 4 the upper part of the sample corresponds to the front face of the funeral mask while the lower part corresponds to its back face. Both sides have developed subsequent layers of corrosion. In areas, these have buckled and become detached.
Cu/Ag, with surface enrichment (Ag)
Hammered and annealed, surface depletion
None
Museum der Kulturen, Basel
2017, metallography and chemical analyses
Nothing to report.
Analyses performed:
XRF with portable X-ray fluorescence spectrometer (NITON XL3t 950 Air GOLDD+ analyser, Thermo Fischer®, SEM/EDS (with an acceleration voltage of 20 kV) and Raman spectroscopy.
The metal is a copper-silver alloy with traces of Pb and As. The surface has been decuprified according to the tumbaga making process (Scott 2000 and McEwan 2000). This pre-Columbian surface enriching technique results in a silver looking object, even though the general silver content is low (about 30%). The metalsmith would repeatedly hammer and anneal the metal, which would create a copper oxide scale on the surface. The latter was then dissolved in acidic plant juices (Scott 2000). This process was repeated until the surface was enriched with silver, giving it the appearance of a silver artefact.
It is impossible to know the original alloy composition, as the proportions have changed through corrosion and migration of elements. Nevertheless, the inner metal is reddish, which could indicate a 30% silver content for 70% copper. The silver-rich surface has been further enriched by the migration of copper ions that have formed the thick corrosion crust on top of the original surface.
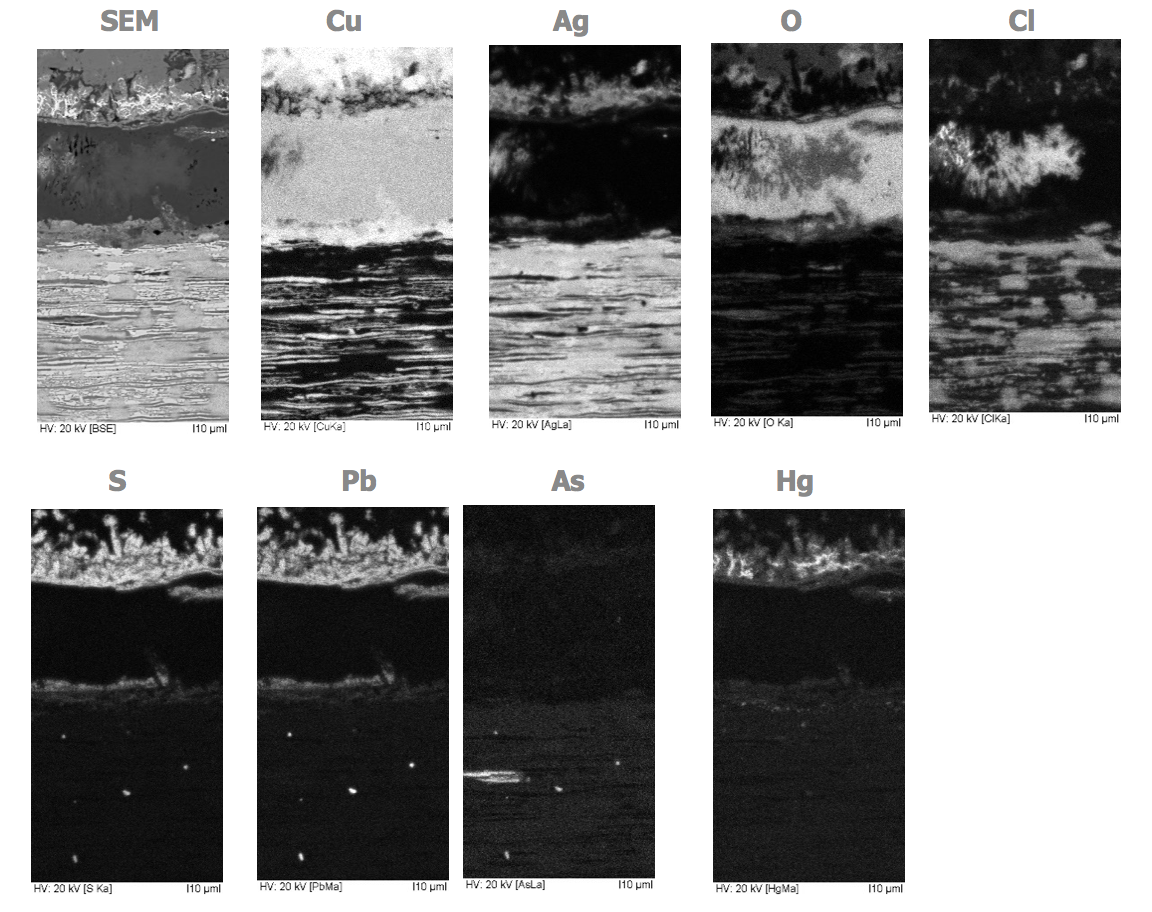
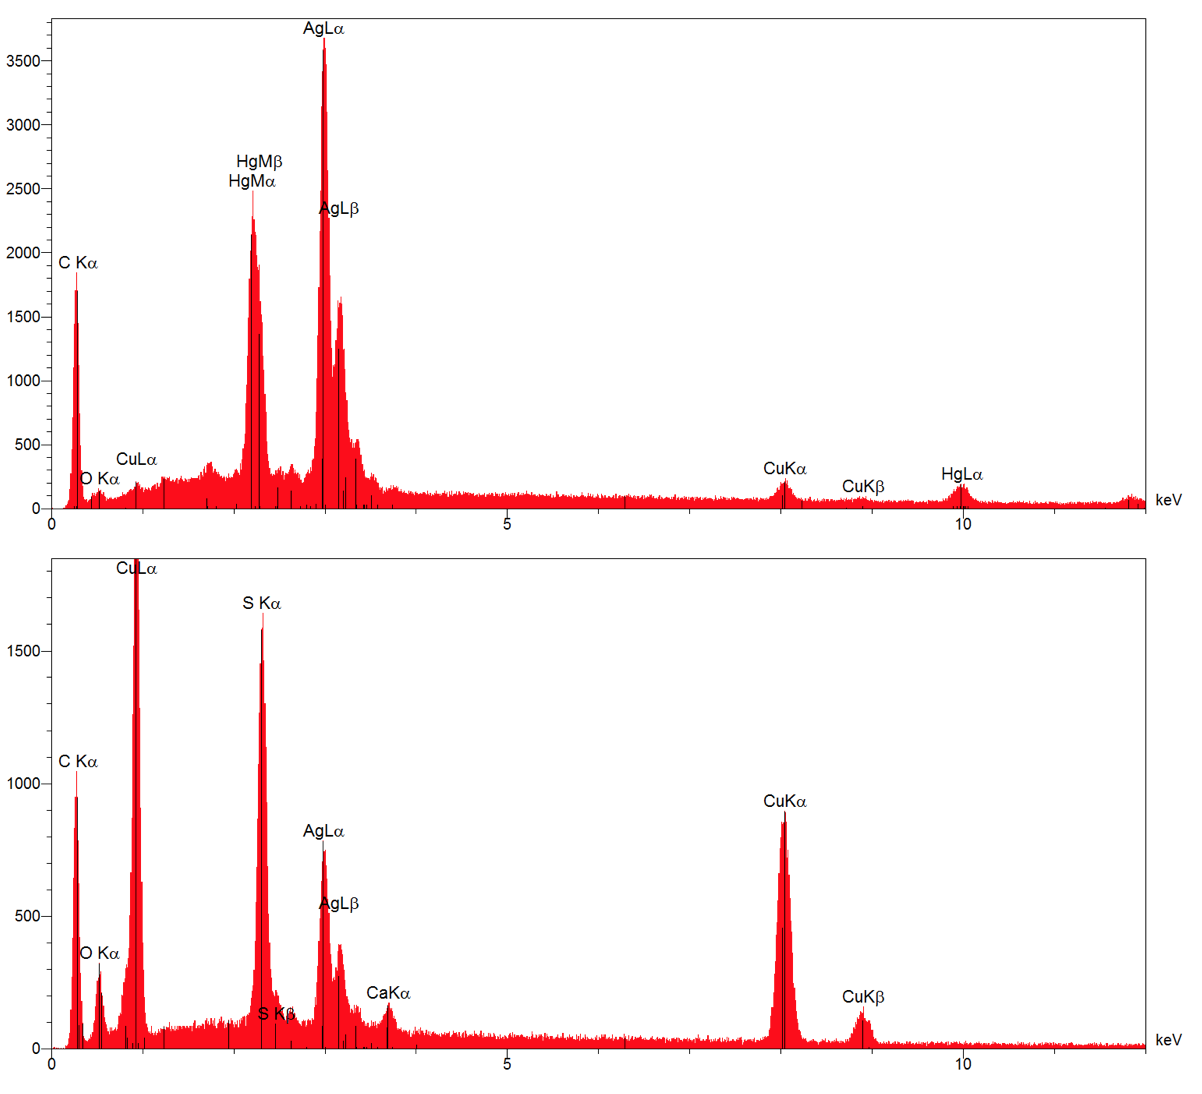
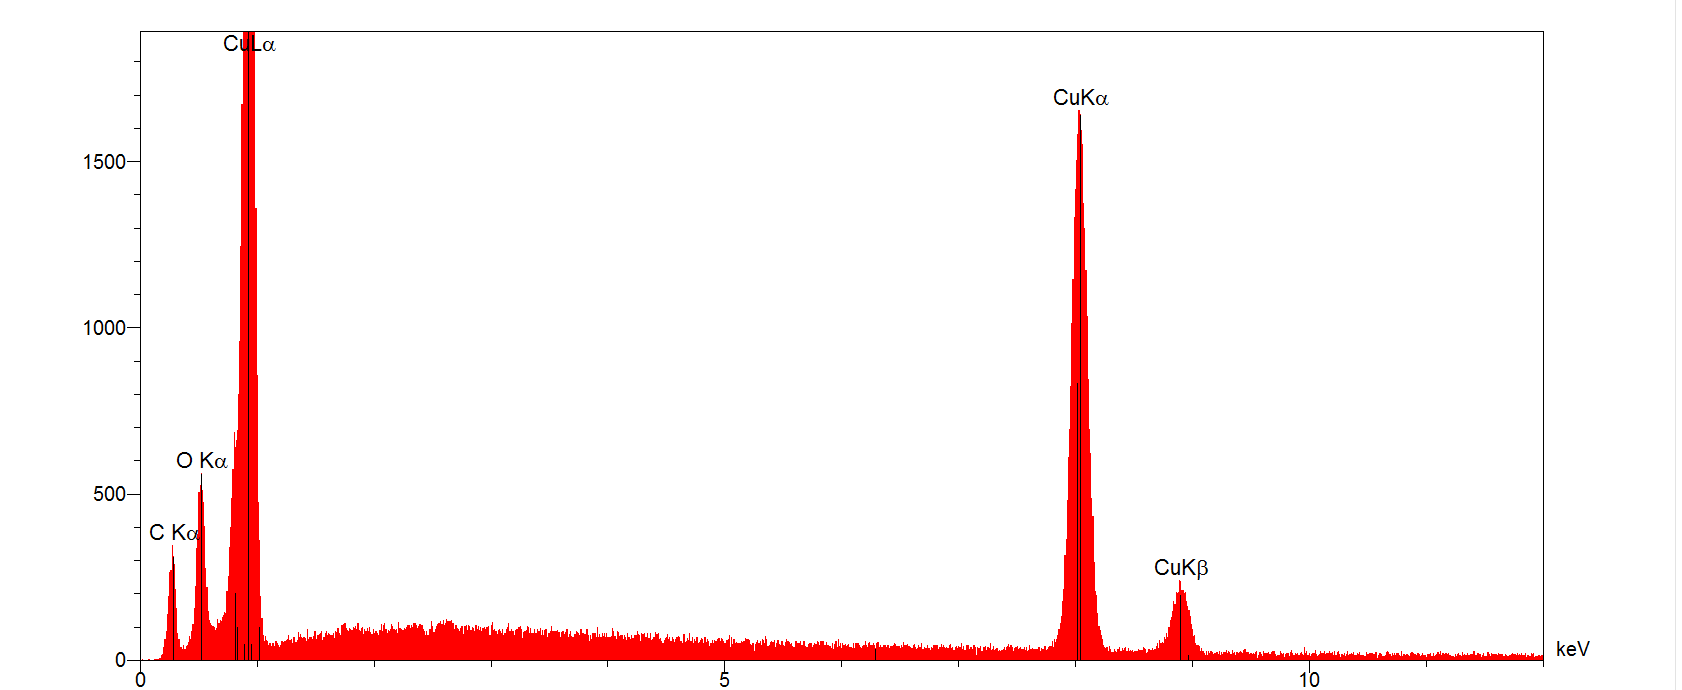
The XRF analysis is a surface analysis that was done without any removal of the copper corrosion products. The proportions are given for the oxide on the surface. The SEM/EDS analysis shows that there are Cu-rich phases alternating with Ag-rich phases. There are inclusions of Pb and As (Fig. 6). Cl has been detected throughout the entire corroded metal, most likely in the form of Cu and Ag corrosion products.
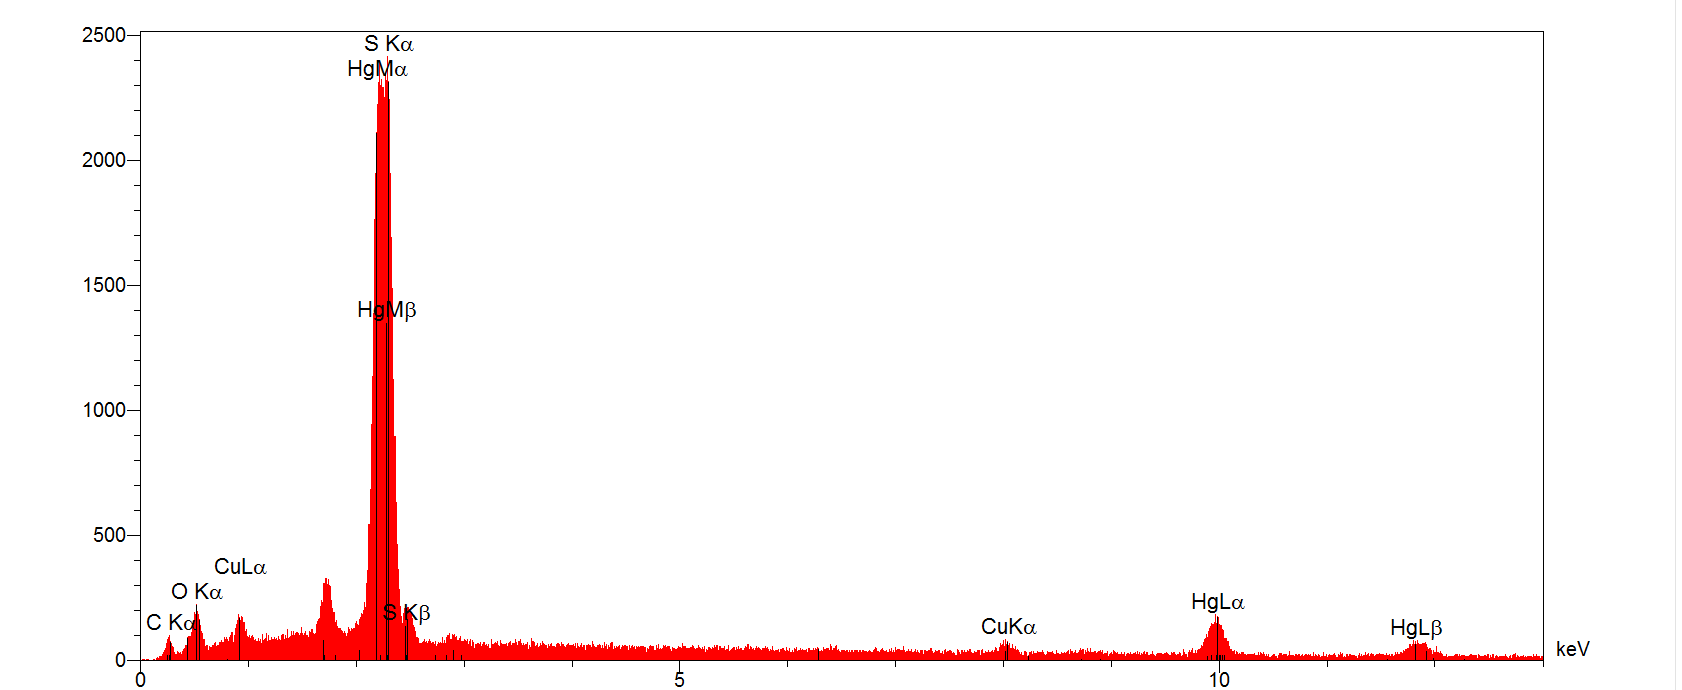
A layer of mercury can be seen with EDS (Figs. 7 and 8). Mercury was not used by the pre-Columbians in metallic form (Scott 2000 and McEwan 2000) but was common as a pigment in form of mercury sulfide (cinnabar).
 Credit HEI Arc, S. Ramseyer.
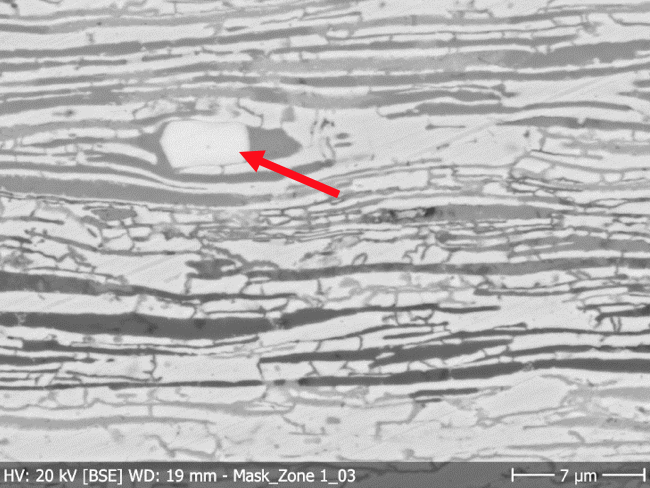
Fig. 6: SEM image (BSE-mode) of the metal sample from Fig. 4 (detail), the elongated grains are the result of repeated hammering. Absence of strain lines indicates that the metal is annealed. The darker areas are Cu-rich phases and the lighter areas are Ag-rich phases. The arrow shows an As- and Pb inclusion,
 Credit HEI Arc, S. Ramseyer.
?
Cu
As, Ag, Pb
Nothing to report.
The remaining metal shows a preferential corrosion of copper and a presence of chlorides (Fig. 9, Table 1). There is a preferential corrosion of copper that has fragilized the structure of the sheet metal.
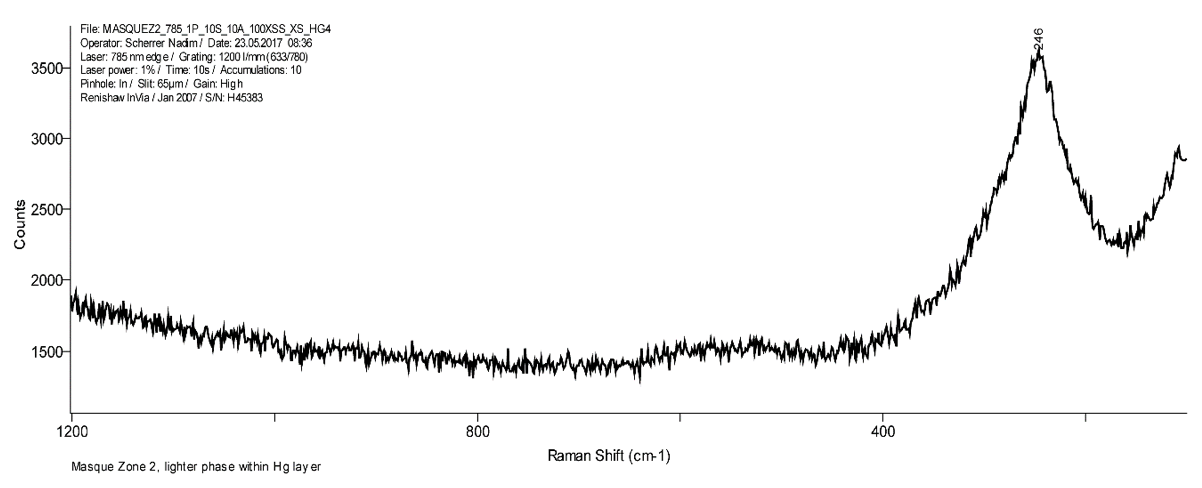
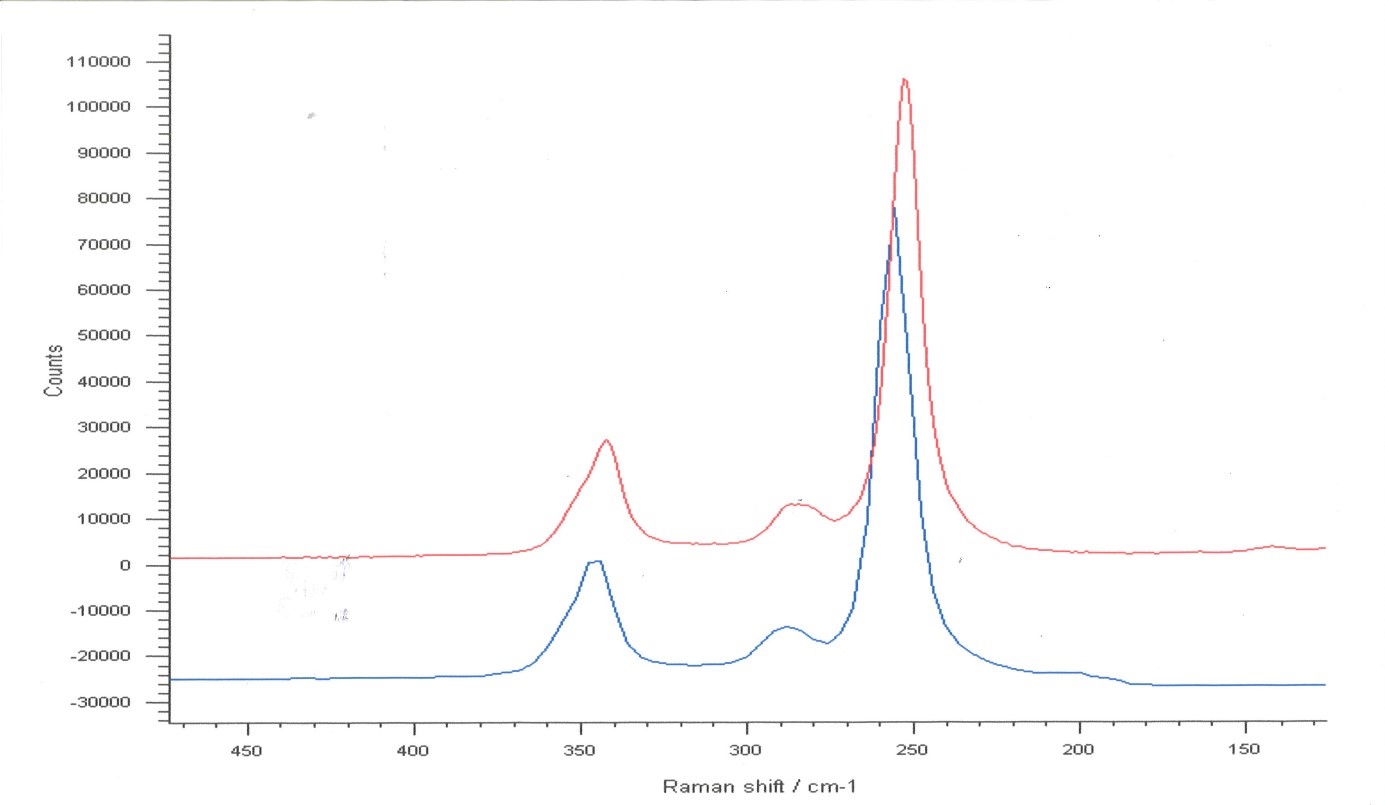
The silver enriched surface is entirely covered with copper corrosion products. The outer green layer (CP1) is a copper carbonate (Fig. 12, Table 1), while the red layers (CP2 in Fig. 5a ; CP4 and CP5 in Fig. 5b) are consisting of a copper oxide, most likely cuprite (Fig. 10). Below the cuprite and above the silver enriched surface on the front face a thin black layer is present (appears grey under polarized light). SEM-EDS analysis shows that in that stratum the mercury of the pigment (Fig. 14) has been transformed into a mercury-silver compound (Figs. 8 and 11a and b) which according to Raman spectrometry (Fig. 15) is not cinnabar anymore. In areas this silver- and mercury-rich surface has been pulled off by raising the corrosion layers, leaving structural voids that were subsequently filled by secondary corrosion products, most likely copper carbonates (Figs. 7 and 8).
The silver sulphide (HgS, cinnabar, Fig. 14), present as a red pigment on the silver surface, could have been reduced through an electrochemical process in the presence of chlorides (Keune 2005). The released sulfur recombined with the silver to form black silver sulphide. Above that layer a porous mercury- and silver rich stratum has formed (see Hg & Ag on cartography Fig. 9). It remains unclear if the limitos is located in the silver enriched surface or within this silver-mercury compound (Fig. 8).
|
Elements |
Cu |
Ag |
O |
Cl |
Hg |
S |
As |
Pb |
Interpretation |
|
Red layer (CP2, |
+++ |
+ |
Copper oxide |
||||||
|
Grey layer (CP3, |
|
+++ |
+++ |
++ |
Pigment (HgS) and silver |
||||
|
Green layer (CP1) |
+++ |
+ |
++ |
Copper carbonate |
|||||
|
Black layer |
+ |
++ |
++ |
Silver and copper sulfides |
|||||
|
Nodules in the metal |
|
+++ |
|
+++ |
|
|
|
|
Silver chlorides |
|
Metal phases 1 |
+ |
+++ |
|
|
|
|
|
|
Silver-rich phases |
|
Metal phases 2 |
+++ |
++ |
+ |
+ |
|
|
|
|
Copper-rich phase |
|
Inclusion in metal |
|
|
+ |
|
|
|
++ |
+++ |
AsPb impurities |
Table 1: Chemical composition of the corrosion crust from Fig. 4. Method of analysis: SEM-EDS, Lab of Electronic Microscopy and Microanalysis, IMA (Néode), HEI Arc (+++: high concentration, ++ medium concentration, + low concentration), credit MiCorr_HEI Arc, S. Ramseyer.
 Credit HEI Arc_S. Ramseyer
 Credit HEI Arc, S. Ramseyer.
 Credit HEI Arc, S. Ramseyer.
 Credit HEI Arc, S. Ramseyer.
 Credit HEI Arc, S. Ramseyer.
 Credit HEI Arc, N. Scherrer.
Uniform - selective
None
Nothing to report.
The schematic representation of corrosion layers of Fig. 7 integrating additional information based on the analyses carried out is given in Fig. 16.
The artefact is a repeatedly hammered, annealed and pickled Cu-Ag tumbaga. The cuprite and hydroxicarbonate layers and the presence of chlorides are typical for the corrosion of tumbaga alloys in an archaeological context. Cinnabar has been identified as pigment applied to the surface before burial. Over the centuries, it was partially incorporated into the growing copper corrosion layers.
Close to the enriched silver surface and below the cuprite layer a silver- and mercury-rich stratum has formed. Only one publication mentions the reaction of cinnabar with a gold-enriched tumbaga surface but does not go into details about the possible mechanism involved (Masuda 1997).
The presence of a silver-sulphur compound below this silver-mercury stratum could indicate that the cinnabar was reduced by electrochemical processes to mercury, releasing sulphur that reacted with the silver enriched surface. The mercury itself formed a silver-mercury layer above the latter. More research is needed to fully comprehend this phenomenon.
| References on object and sample |
|
Reference objects |
| References on analytic methods and interpretation |